머신러닝을 활용하여 전공의 수행능력에 대한 주치의 피드백 평가하기 (Anesth Analg. 2021)
Using Machine Learning to Evaluate Attending Feedback on Resident Performance
Sara E. Neves, MD,* Michael J. Chen, BS,* Cindy M. Ku, MD,† Suzanne Karan, MD,‡ Amy N. DiLorenzo, PhD,§ Randall M. Schell, MD, MACM,§ Daniel E. Lee, MD, PhD,║ Carol Ann B. Diachun, MD, MSEd,¶ Stephanie B. Jones, MD,# and John D. Mitchell, MD*

고품질의 활용도 높은 피드백을 제공하는 것은 교육생 개발에 필수적이며, 교육생들이 매우 원합니다.4-7 활용도 높은 피드백은 레지던트를 위한 개선 계획을 수립하는 데 도움이 됩니다. 반대로 부실한 피드백은 학습자가 좌절감을 느끼고 대응 방법을 불확실하게 만들어 해로운 영향을 미칠 수 있습니다.8 고품질 피드백은 상세하고 구체적이며 행동 중심적이고 실행 가능하며 개선 영역을 제공합니다.9 이러한 피드백은 피드백을 기존의 자기 평가와 조정하는 자기 성찰을 촉진하여 향후 실습에 피드백을 통합하는 데 도움을 줍니다.10 형성적 평가는 체크리스트를 통해 수집할 수 있지만, 연구 결과에 따르면 전문성 및 커뮤니케이션과 관련된 서술적 피드백은 학습자를 지도하는 데 특히 유용합니다.11 서술적 피드백을 검토하면 교수진에게 피드백을 제공하고 지속적으로 개선하는 방법을 가르치는 워크숍과 같은 프로그램을 개발할 수 있습니다.
The delivery of high-quality and high-utility feedback is essential to the development of trainees, and is highly desired by them.4–7 High-utility feedback helps devise improvement plans for residents. Conversely, poor feedback can have deleterious effects by leaving learners frustrated and uncertain how to respond.8 High-quality feedback is detailed, specific, behavior-focused, actionable, and provides areas for improvement.9 Such feedback promotes self-reflection to reconcile feedback with existing self-assessments, helping incorporate feedback into future practice.10 While formative assessments can be collected via checklists, research demonstrates narrative feedback related to professionalism and communication is particularly valuable for guiding learners.11 Reviewing narrative feedback enables development of programs such as workshops to teach faculty how to provide feedback and continuously improve it.
이전에는 평가자가 온라인 양식을 통해 제공된 의견을 수동으로 검토하고 점수를 매겨야 하는 피드백 평가 시스템을 개발하여 시행했습니다.11 물류상의 문제로 인해 이 중요한 도구를 일관성 있게 적용하지 못했고, 레지던트에 대한 피드백의 품질과 유용성에 대해 직원에게 적시에 피드백을 제공하지 못했습니다. 수동 피드백 평가는 시간이 많이 걸립니다. 저희의 경험에 따르면, 먼저 평균 6시간의 평가자 교육과 보정이 필요합니다. 그런 다음 피드백을 수집하고, 비식별화하여 평가자가 점수를 매기고, 다시 제공자에게 매핑해야 합니다. 최근 한 저자(J.D.M.)의 채점 작업에는 총 15시간이 소요되었으며, 이는 베스 이스라엘 디코니스 메디컬 센터의 마취과 레지던트 프로그램에서 한 달 동안 받은 피드백에 해당하는 200개의 코멘트를 수집하고 채점하는 데 소요된 시간입니다.
We previously developed and implemented a feedback rating system that required raters to manually review and score comments provided via online forms.11 Logistical challenges resulted in inconsistent application of this valuable tool and prevented us from providing timely feedback to staff on the quality and utility of their feedback to residents. Manual feedback rating is time-consuming. In our experience, it first entails an average of 6 hours of rater training and calibration. It then requires feedback be collected, deidentified, scored by raters, and mapped back to providers. A recent scoring effort by an author (J.D.M.) totaled 15 hours to collate and score 200 comments, representing a month of feedback from Beth Israel Deaconess Medical Center’s anesthesiology residency program.
머신러닝(ML)은 데이터를 분석하고 과거 정보를 바탕으로 자동으로 작업을 완료하는 방법을 학습하는 인공 지능 시스템 또는 컴퓨터 프로그램의 개발과 관련이 있습니다. ML은 진단12 및 방사선 영상 처리 등 의학 분야에서 광범위하게 응용되고 있습니다.13,14 ML은 의학교육에서도 많은 잠재적 응용 분야와 함께 큰 관심을 받고 있습니다.15 ML로 촉진된 사례 로깅과 분석을 함께 사용하면 레지던트 평가의 준수 및 적시성을 높이는 데 도움이 되었습니다.16 또한 수련 중 시험 점수를 사용하여 보드 시험에서 레지던트의 성과를 예측하는 데 적용되고 있습니다.17
Machine learning (ML) involves development of artificially intelligent systems or computer programs that analyze data and learn to complete tasks automatically based on historical information. It has found a wide range of applications in medicine, including diagnostics12 and radiology image processing.13,14 ML is also of significant interest in medical education, with many potential applications.15 Using ML-facilitated case logging coupled with analytics has helped increase compliance and timeliness of resident evaluations.16 It has also been applied to predict resident performance on Board examinations using in-training examination scores.17
ML 모델은 일단 개발되면 대량의 정보를 신속하고 자율적으로 처리할 수 있습니다. 우리는 레지던트에 대한 교수진의 서면 피드백을 평가하고 피드백을 신속하게 검토 및 평가할 수 있는 예측 모델을 만들고자 했습니다. 우리의 가설은 ML 모델을 개발하고 적용하여 활용도가 낮고 품질이 낮은 피드백을 독립적이고 효율적으로 식별할 수 있다는 것이었습니다.
Once developed, ML models can process large volumes of information rapidly and autonomously. We sought to create predictive models to assess written faculty feedback to residents, to expedite the review and assessment of feedback. Our hypothesis was that we could develop and apply ML models to independently and efficiently identify low-utility and low-quality feedback.
방법
METHODS
피드백 수집 및 채점
Feedback Collection and Scoring
이전 연구에서,11 3명의 숙련된 교육자(J.D.M., S.B.J., C.M.K.)가 마취과 레지던트(대학원 2~4년차)의 성과에 관한 1925개의 피드백 코멘트를 blindly 평가했습니다. 이러한 의견은 4개 기관의 마취과 레지던트 프로그램에서 수집되었습니다: 베스 이스라엘 디코니스 메디컬 센터, 로체스터 대학교 메디컬 센터, 켄터키 대학교 의과대학, 캘리포니아 대학교 샌디에이고. 피드백 의견은 당일 또는 단기간 동안 레지던트와 함께 근무한 주치의가 전자 평가 시스템에 입력한 정성적인 자유 텍스트였습니다. 평가자는 피드백 특성의 존재를 확인하고 할당된 의견에 대한 유용성 점수를 제공했습니다. 146명의 주치의 평가자가 190명의 레지던트에 대해 의견을 제공했으며, 평가자당 의견의 중앙값은 5개, 한 명의 평가자가 제공한 의견은 최대 67개(데이터 세트의 3.48%)였습니다. 레지던트당 코멘트의 중앙값은 10건이었으며, 한 레지던트에 대한 코멘트은 최대 31건(데이터 세트의 1.61%)이었습니다. 의견은 2013년부터 2014년까지 약 8개월 동안 미국 내 4개의 레지던트 프로그램에서 수집되었습니다. 데이터 수집을 시작하기 전에 4개 기관 모두에서 사전 동의서 면제와 함께 기관생명윤리위원회(IRB)의 승인을 받았습니다.
In a prior study,11 3 experienced educators (J.D.M., S.B.J., C.M.K.) blindly rated 1925 feedback comments regarding performance of anesthesiology residents (Postgraduate Years 2–4). These comments were collected from anesthesiology residency programs from 4 institutions: Beth Israel Deaconess Medical Center, University of Rochester Medical Center, University of Kentucky College of Medicine, and University of California San Diego. Feedback comments were qualitative free text entered into an electronic evaluation system by an attending physician who worked with a resident that day or over a short period of time. Raters identified the presence of feedback traits and provided utility scores for their assigned comments. Comments were provided by 146 different attending evaluators on 190 different residents, with a median of 5 comments per evaluator and maximum of 67 comments provided by a single evaluator (3.48% of the dataset). There was a median of 10 comments per resident, with a maximum of 31 comments concerning a single resident (1.61% of the dataset). Comments were collected from 4 residency programs in the United States from over a course of roughly 8 months between 2013 and 2014. Institutional review board (IRB) approval with a waiver of documentation of informed consent was obtained at all 4 institutions before the start of data collection.
예측 모델 개발
Predictive Model Development
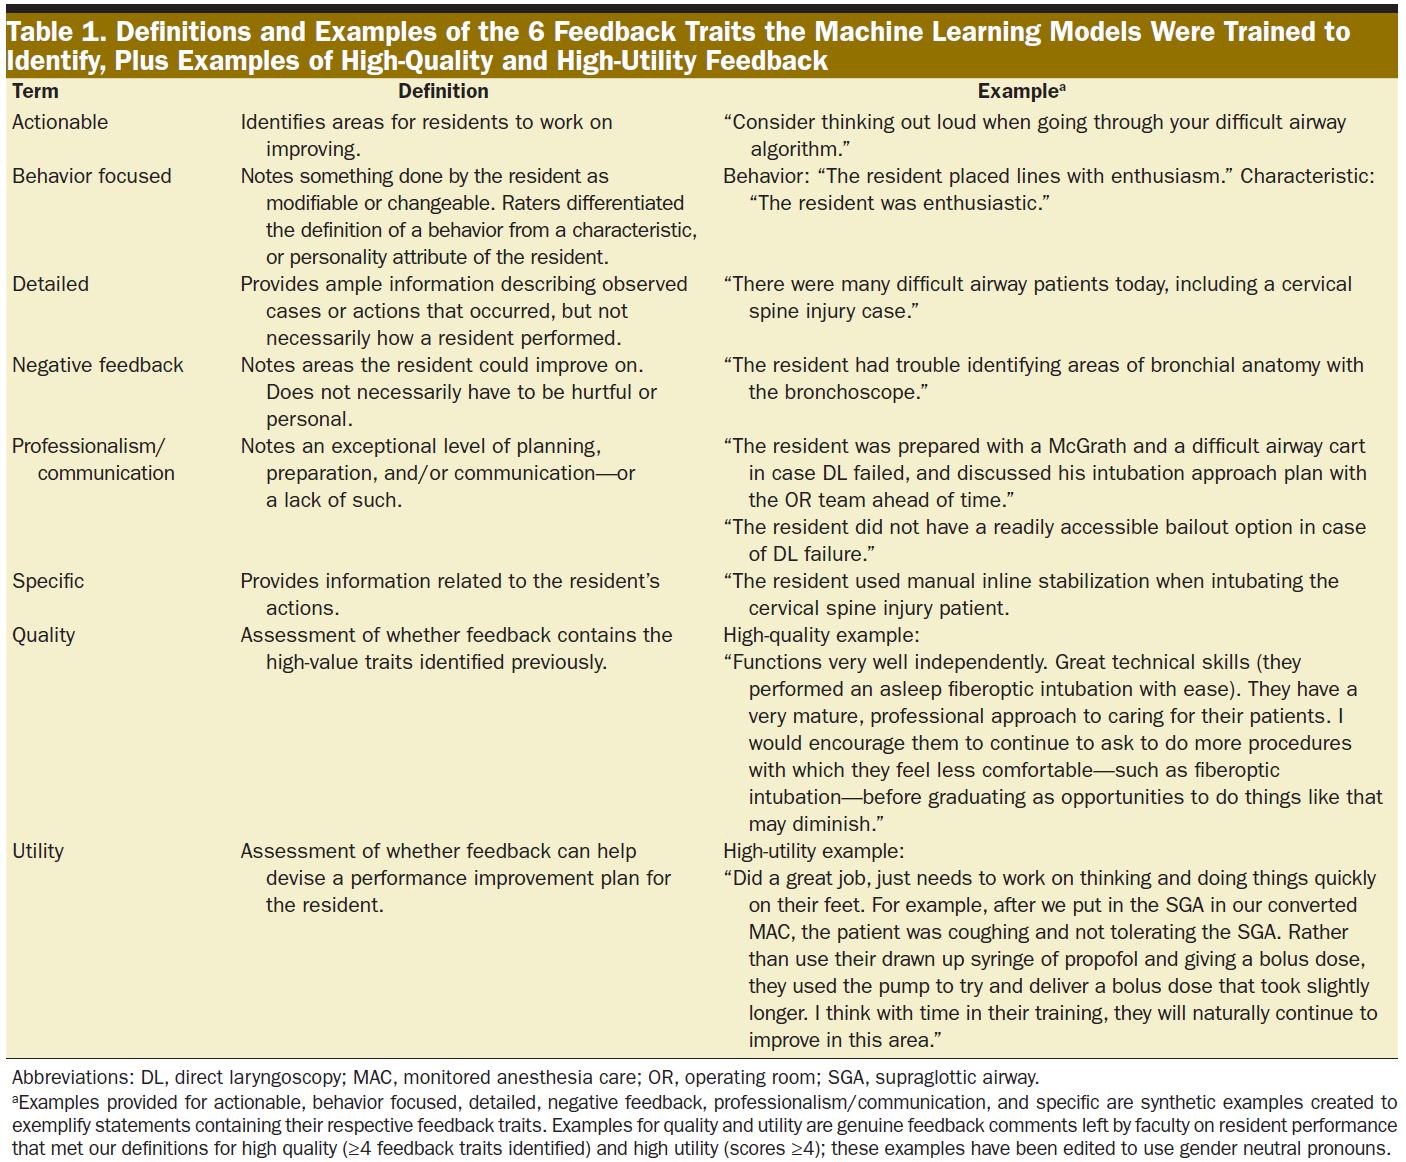
ML 모델은 6가지 피드백 특성(실행 가능, 행동 중심, 상세, 부정적 피드백, 전문성/소통, 구체적)을 식별하도록 학습되었습니다(정의와 예시는 표 1에 나와 있습니다). 피드백 특성은 존재하거나 존재하지 않는 것으로 간주되었습니다. 개선의 여지가 있는 코멘트를 식별하기 위해 6가지 특성 중 4개 이상이 존재하는 것으로 확인된 항목은 고품질로 간주하고 3개 미만인 항목은 저품질로 간주했습니다. 원래 평가자들은 교육자가 레지던트를 위한 개선 계획을 수립하는 데 피드백이 얼마나 유용한지를 설명하는 피드백 코멘트의 유용성 점수를 1~5점으로 매겼으며(표 1), 3점은 평균적인 유용성을 가진 코멘트를 나타냅니다. 개선할 수 있는 의견을 식별하기 위해 활용도 점수가 4점과 5점인 경우 활용도가 높은 것으로 간주하고 1점, 2점, 3점인 경우 활용도가 낮은 것으로 간주했습니다.
ML models were trained to identify 6 feedback traits:
- actionable,
- behavior focused,
- detailed,
- negative feedback,
- professionalism/communication, and
- specific;
definitions and examples are displayed in Table 1. Feedback traits were considered to be either present or not present. To identify comments that had room for improvement, entries that had ≥4 of the 6 traits identified as present were considered high-quality while entries with ≤3 were considered low-quality. The original raters had assigned feedback comments utility scores from 1 to 5 describing how useful feedback would be in helping educators shape an improvement plan for the resident (Table 1), with scores of 3 representing comments of average utility. To identify comments that could improve, utility scores of 4 and 5 were considered high-utility while scores of 1, 2, and 3 were considered low-utility.
사용된 데이터 과학 플랫폼은 RapidMiner Studio, 버전 9.6(2020), 교육용 라이선스 에디션(RapidMiner, Inc, 보스턴, 매사추세츠)입니다.18 RapidMiner는 Java로 작성되었으며 데이터 준비, ML 및 예측 모델 배포에 사용됩니다. 그림 1은 프로젝트 및 ML 워크플로우를 보여주며, 주석이 달린 스크린샷 예시는 보충 디지털 콘텐츠 1, 그림, https://links.lww.com/AA/D228, 모델 개발을 위한 데이터 테이블을 생성하는 RapidMiner 워크플로우 프로세스의 주석이 달린 스크린샷과 보충 디지털 콘텐츠 2, 그림, https://links.lww.com/AA/D229, RapidMiner에서 수행되는 텍스트 처리 단계의 주석이 달린 스크린샷에서 확인할 수 있습니다. 일반적인 ML 용어에 대한 자세한 정의는 용어집을 참조하세요.
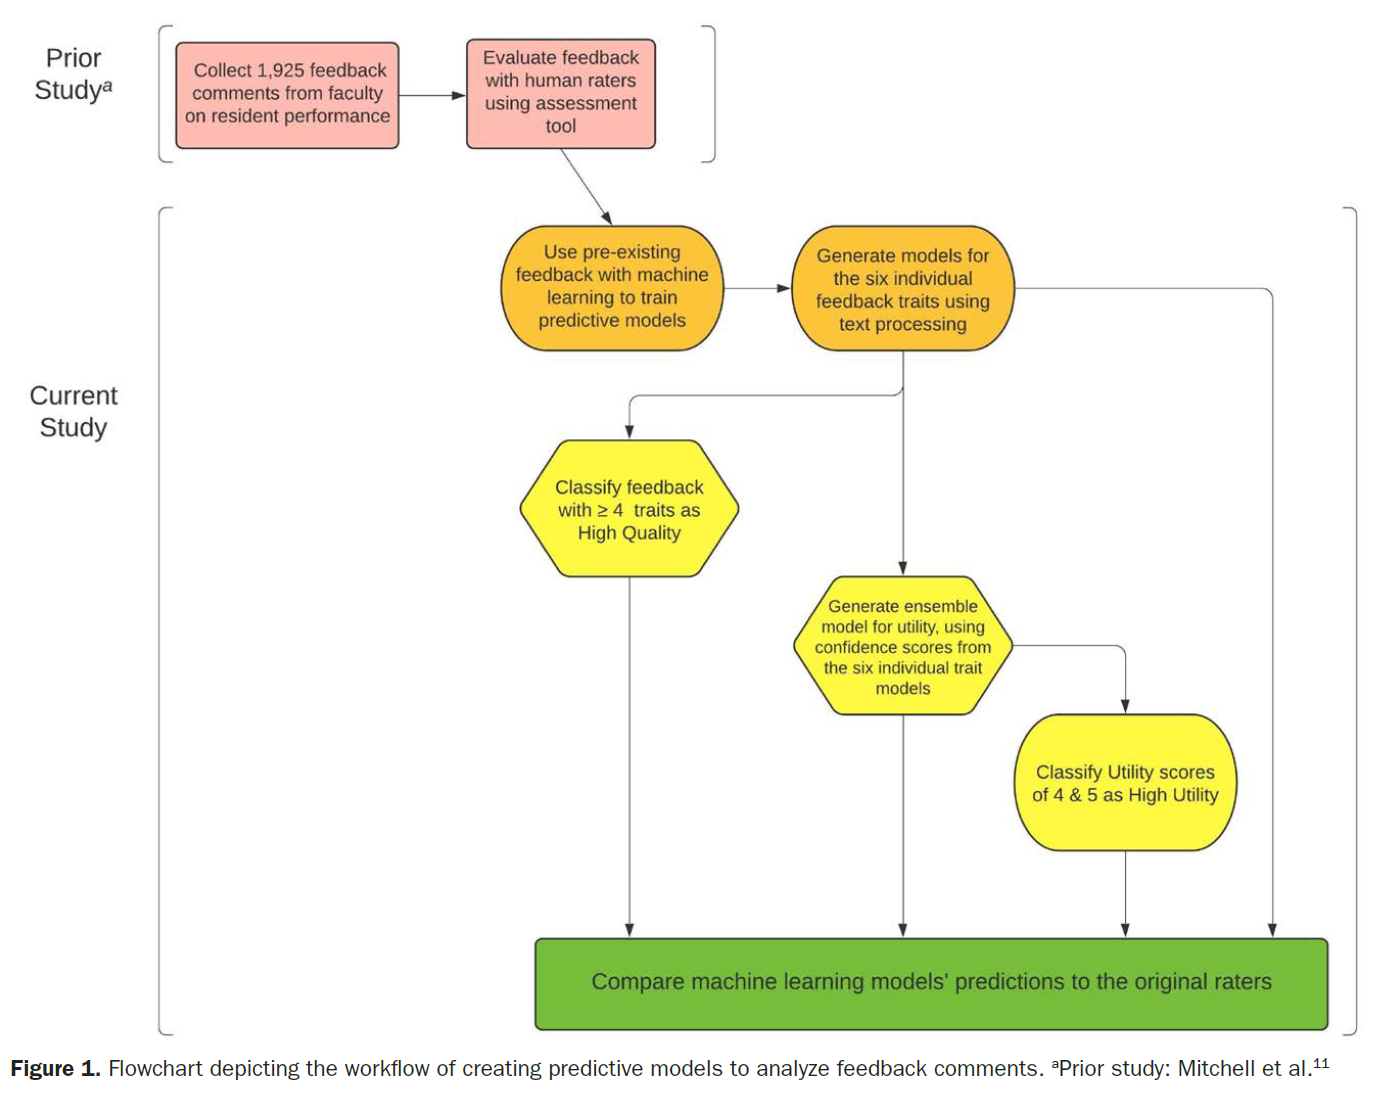
The data science platform used was RapidMiner Studio, version 9.6 (2020), educational license edition (RapidMiner, Inc, Boston, MA).18 RapidMiner is written in Java and used for data preparation, ML, and deployment of predictive models. Figure 1 depicts our project and ML workflow; annotated screenshot examples of workflows in RapidMiner can be seen in Supplemental Digital Content 1, Figure, https://links.lww.com/AA/D228, an annotated screenshot of RapidMiner workflow process to create data table for model development; and Supplemental Digital Content 2, Figure, https://links.lww.com/AA/D229, an annotated screenshot of the text processing steps taken in RapidMiner. Please see the glossary for detailed definitions of common ML terms.
먼저 6가지 피드백 특성 각각에 대해 개별 예측 모델을 만들었습니다. 텍스트 처리 단계에서는 텍스트를 단어로 분리하고, 중요도가 낮은 단어를 제거하고(텍스트 처리 중에 제거되는 단어의 유형을 설명하는 보충 디지털 콘텐츠 3, 표, https://links.lww.com/AA/D230 참조), 스노우볼 알고리즘을 통해 어간이 같은 단어를 풀링하고1, 용어 빈도 역 문서 빈도(TF-IDF) 점수를 추출했습니다. TF-IDF는 단어와 문서의 관련성에 대한 가중치를 부여한 통계적 척도로, 문서 세트 전체에서 얼마나 자주 나타나는지에 따라 상쇄됩니다.2 TF-IDF 점수, 문자 길이, 코멘트의 의미 있는 단어 수는 피드백 특성을 감지하기 위한 예측 모델을 생성하기 위한 ML 알고리즘의 입력으로 사용되었습니다. 텍스트 처리로 생성된 테이블의 스크린샷 예시는 보충 디지털 콘텐츠 4, 그림, https://links.lww.com/AA/D231, 텍스트 처리로 생성된 단어 목록 테이블의 스크린샷과 보충 디지털 콘텐츠 5, 그림, https://links.lww.com/AA/D232, 텍스트 처리로 생성된 데이터 테이블의 스크린샷에서 확인할 수 있습니다.
We first created individual predictive models for each of our 6 feedback traits. Text processing steps separated text into words, removed words with low significance (see Supplemental Digital Content 3, Table, https://links.lww.com/AA/D230, which describes types of words removed during text processing), pooled words with the same stem via Snowball algorithm,1 and extracted term frequency-inverse document frequency (TF-IDF) scores. TF-IDF is a weighted statistical measure of a word’s relevance to a document, offset by how frequently it appears across the set of documents.2 TF-IDF scores, character length, and number of meaningful words in comments were used as inputs for ML algorithms to create predictive models for detecting the presence of feedback traits. Screenshot examples of the tables generated from text processing can be seen in Supplemental Digital Content 4, Figure, https://links.lww.com/AA/D231, screenshot of a wordlist table generated from text processing; and Supplemental Digital Content 5, Figure, https://links.lww.com/AA/D232, screenshot of a data table generated from text processing.
예측 모델을 생성하기 위해 RapidMiner의 자동 모델 확장 기능이 사용되었습니다. 자동 모델은 사용 가능한 데이터의 60%를 사용하여 모델을 학습시키고, 40%의 데이터는 7개의 분리된 하위 집합으로 분할하여 생성된 모델의 점수를 매기기 위해 예약합니다. 가장 크고 성능이 우수한 하위 집합은 제거되고 나머지 5개 하위 집합의 평균 성능 메트릭이 보고됩니다. 이 접근 방식은 모델 타당성 검사 품질과 런타임의 균형을 맞춥니다. 또한 자동 모델은 관련 없는 입력을 제외하여 기능 선택을 최적화하여 정확도와 단순성을 높인 모델을 생성할 수 있습니다. 모델 학습에 도움이 되지 않는 변수를 식별한 후, 각 특성에는 특징 선택을 수행하기 전에 고려해야 할 21~23개의 입력이 있었습니다. 특징 선택에 할당된 시간은 자동 모델 실행당 30분으로 임의로 제한했으며, 이 프로세스는 감독을 필요로 하지 않았습니다.
RapidMiner’s Auto Model extension was used to create our predictive models. Auto Model uses 60% of available data to train models; 40% of data is split into 7 disjointed subsets and reserved for scoring generated models. The largest and highest performing subsets are removed, and average performance metrics on the remaining 5 subsets are reported. This approach balances model validation quality and runtimes. Furthermore, Auto Model can optimize feature selection by excluding irrelevant inputs to create models with greater accuracy and simplicity. After identifying variables unlikely to help train models, each trait had 21–23 inputs to consider before performing feature selection. We limited time allotted for feature selection to an arbitrary 30 minutes per Auto Model run; this process did not require supervision.
초기 모델링 시도에서는 관찰된 우세한 클래스의 예측에 크게 치우쳐 데이터 세트에 과도하게 적합한 모델이 생성되었습니다. 예를 들어, 평가자들은 원래 코멘트의 75.7%를 전문성이나 커뮤니케이션과 관련이 없는 것으로 평가했는데, 모델은 단순히 모든 코멘트가 전문성이나 커뮤니케이션과 관련이 없는 것으로 예측함으로써 이러한 정확도를 달성할 수 있었고, 일부 경우에는 정확히 그렇게 했습니다. 이는 정확한 예측으로 인한 이익과 잘못된 예측으로 인한 비용의 합계를 최대화하는 것을 목표로 하는 모델에서 비롯된 것입니다.
Initial modeling attempts resulted in models that overfit datasets by heavily favoring the prediction of the observed predominant class. For example, raters originally scored 75.7% of our comments as not pertaining to professionalism or communication; models could achieve this accuracy by simply predicting all comments to not pertain to professionalism or communication, and did exactly that in some cases. This stemmed from models aiming to maximize the sum value of gains from correct predictions versus costs from wrong predictions.
이러한 클래스 불균형 문제를 해결하기 위해 각 모델을 생성하는 동안 비용 행렬을 조정하여 모델이 비우세 클래스를 정확하게 추측하는 데 더 높은 가치를 부여하고, 예시를 우세 클래스로 잘못 예측하는 데 더 큰 불이익을 주도록 했습니다.3 특성의 경우, 평가자가 특성이 존재한다고 언급한 코멘트와 그렇지 않은 코멘트의 비율에 따라 비용 행렬을 수정했습니다. 유용성의 경우, 각 유용성 점수 값에 대해 원래 평가자가 주어진 값으로 점수를 매긴 코멘트 수와 우세한 유용성 점수에서 코멘트 수의 비율을 기준으로 비용 매트릭스를 수정했습니다. 각 모델의 비용 매트릭스에 대한 자세한 내용은 특성 모델 개발의 비용 매트릭스를 자세히 설명하는 보충 디지털 콘텐츠 6과 유용성 모델 개발의 비용 매트릭스를 자세히 설명하는 보충 디지털 콘텐츠 7에 나와 있습니다.
To address this issue of class imbalance, we adjusted the cost matrix during each model generation so that models would place higher value in correctly guessing nonpredominant classes and more heavily penalize incorrectly predicting examples as the predominant class.3 For traits, cost matrices were modified based on the ratio of comments where traits were noted to be present by raters versus comments that were not. For utility, the cost matrix was modified for each utility score value based on the ratio of the number of comments scored as a given value by the original raters versus the number of comments in the predominant utility score. Details on each model’s cost matrix are displayed in Supplemental Digital Content 6, Table, https://links.lww.com/AA/D233, which details cost matrices for trait model development; and Supplemental Digital Content 7, Table, https://links.lww.com/AA/D234, which details the cost matrix for utility model development.
유용성의 경우, 코멘트에 대한 텍스트 처리 워크플로우를 처음 시도했을 때 적합하지 않은 모델이 생성되었습니다. 따라서 6개의 피드백 특성 모델에서 생성된 신뢰도 점수 값을 사용하여 앙상블 모델을 생성하여 유용성 점수 예측을 생성했습니다.
For utility, initial attempts with our text processing workflow on comments generated ill-fitting models. We therefore created an ensemble model using confidence score values generated by the 6 feedback trait models to generate utility score predictions.
점수 모델
Scoring Models
모델을 생성한 후, 점수 데이터에서 가장 높은 순이익을 얻은 알고리즘을 선택했습니다. 유용성 범주와 품질 범주는 각각 유용성 점수와 특성 존재 여부에 대한 모델 예측에서 추정되었습니다. 6가지 피드백 특성, 유용성 범주 및 품질 범주 모두에 대해 원래 평가자와 모델 간의 평가자 간 일치도(정확도)를 계산했습니다. 유용성 점수의 경우, 평가자 간 일치도를 평가하고 앙상블 모델과 원래 평가자 간의 평균 절대 오차(MAE)와 평균 제곱 오차(RMSE)를 계산했습니다. 앙상블 모델이 코멘트 길이만을 기준으로 유용성 범주를 할당하지 않도록 하기 위해, 코멘트이 유용성이 높은 것으로 예측된 경우와 낮은 것으로 예측된 경우의 문자 수 사전 처리 통계를 비교했습니다.
After generating models, we selected the algorithms with the highest net gains on the scoring data. Utility category and quality category were extrapolated from model predictions on utility score and trait presence respectively. Interrater agreement (accuracy) was calculated between the original raters and our models for all 6 feedback traits, utility category, and quality category. For utility score, we assessed the interrater agreement and calculated the mean absolute error (MAE), and root mean square error (RMSE) between our ensemble model and the original raters. To ensure the ensemble model was not assigning utility categories solely based on comment length, we compared statistics for character count pretext processing when comments were predicted as high- versus low-utility.
결과
RESULTS
피드백 특성 모델
Feedback Trait Models
최종 예측 모델의 구성과 해당 점수 하위 집합(n = 550)에 대한 성능에 관한 자세한 내용은 표 2에 설명되어 있습니다. 따옴표로 묶인 용어는 따옴표로 묶인 단어 어간의 TF-IDF 점수가 입력되었음을 나타냅니다. 민감도와 특이도의 경우, 양성 클래스는 특성 모델에 대해 "특성 존재"로 설정되었으며, 이러한 메트릭은 여러 클래스 값을 가진 유용성에는 적용되지 않았습니다. 6가지 피드백 특성의 존재 여부에 대한 평균 합산 일치도는 전체 데이터 세트(n = 1925)에서 4.6(표준 편차 1.3)이었으며 중앙값은 5였습니다. 피드백 특성 모델의 정확도는 74.4%에서 82.2%에 달했습니다.
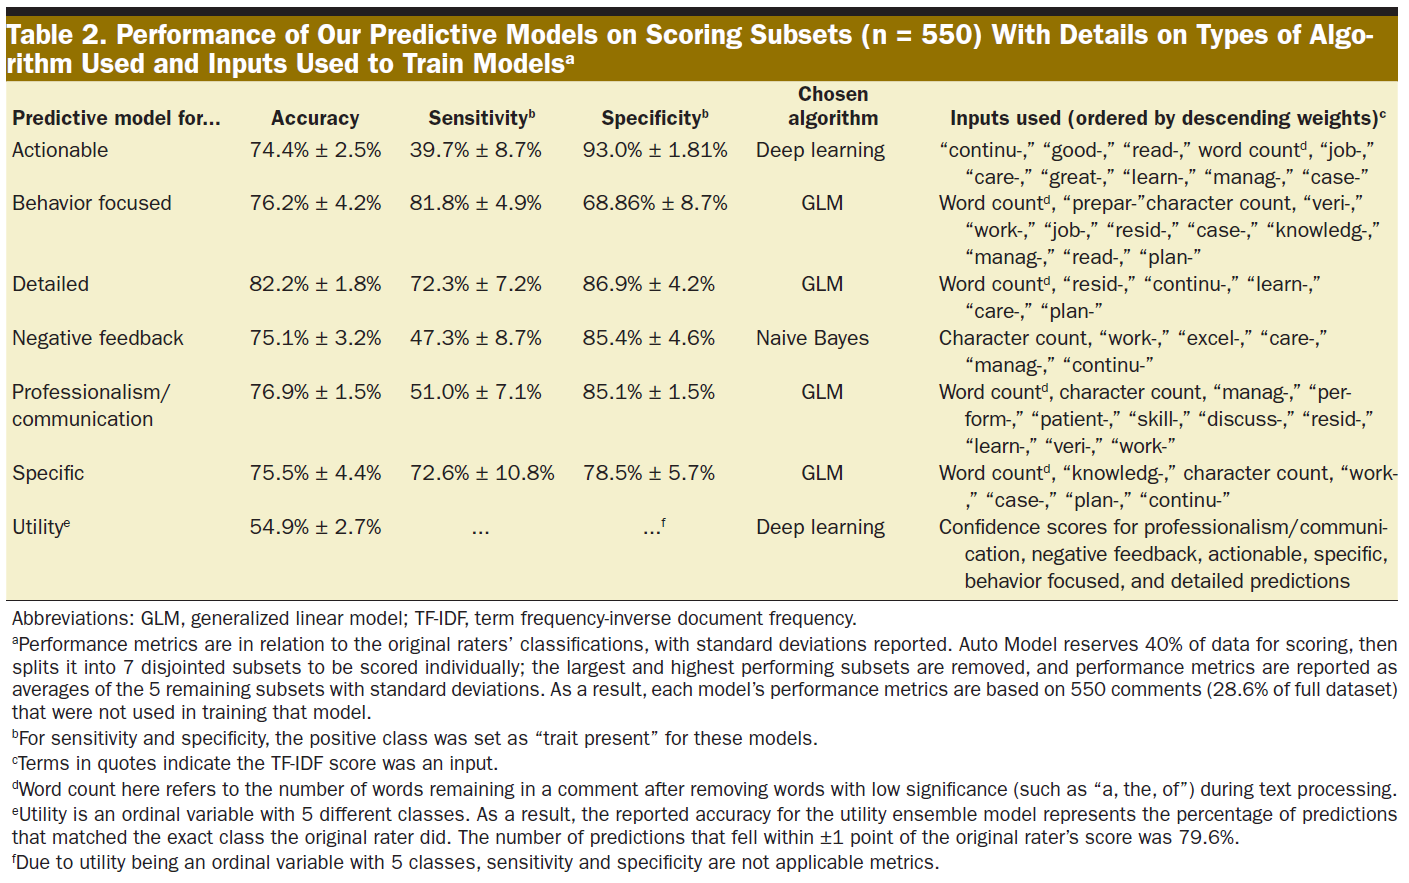
Details regarding the construction of our final predictive models and their performance on their scoring subsets (n = 550) are described in Table 2. Terms in quotes indicate the TF-IDF score of the quoted word stem was an input. For sensitivity and specificity, the positive class was set as “trait present” for the trait models; these metrics did not apply to utility with its multiple class values. Mean sum concordance on presence of the 6 feedback traits was 4.6 (standard deviation of 1.3) across the full dataset (n = 1925), with a median of 5. Feedback trait models had accuracies ranging from 74.4% to 82.2%.
유틸리티 점수 예측
Utility Score Predictions
채점 하위 집합에 대한 원래 평가자와 모델의 유용성 점수를 비교한 결과, 0.7 ± 0.9의 MAE와 1.2의 RMSE가 산출되었습니다. 유용성 예측은 채점 하위 집합에서 54.9%의 경우 원래 평가자의 정확한 점수와 일치했으며, 원래 평가자의 점수와 ±1점 이내로 일치한 예측의 수는 79.6%였습니다. 그림 2는 전체 데이터 세트(n = 1925)에서 예측된 유용성 점수의 분포를 원래 평가자와 비교한 것입니다. 원래 평가자의 유용성 점수는 평균 1.9점, 중앙값 1점(전체 코멘트의 50.6%가 원래 유용성 1점으로 평가됨), 표준편차 1.2점, 높은 양의 왜곡 값 1.10점, 첨도 0.1점이었습니다. 앙상블 모델의 예측된 유용성 점수는 평균 2.0, 중앙값 2, 표준편차 1.2, 중간 정도의 높은 양의 왜곡도 값 0.98, 첨도 -0.1이었습니다.
Comparing the original raters’ and our models’ utility scores on the scoring subset, we calculated an MAE of 0.7 ± 0.9 and RMSE of 1.2. Utility predictions matched the original raters’ exact scores 54.9% of the time on the scoring subset; the number of predictions that fell within ±1 point of the original rater’s score was 79.6%. Figure 2 compares the distribution of predicted utility scores to the original raters, on the full dataset (n = 1925). The original raters’ utility scores had a mean of 1.9, median of 1 (50.6% of all comments were originally rated as a 1 for utility), standard deviation of 1.2, high positive skewness value of 1.10, and kurtosis of 0.1. Our ensemble model’s predicted utility scores had a mean of 2.0, median of 2, standard deviation of 1.2, moderately high positive skewness value of 0.98, and kurtosis of −0.1.
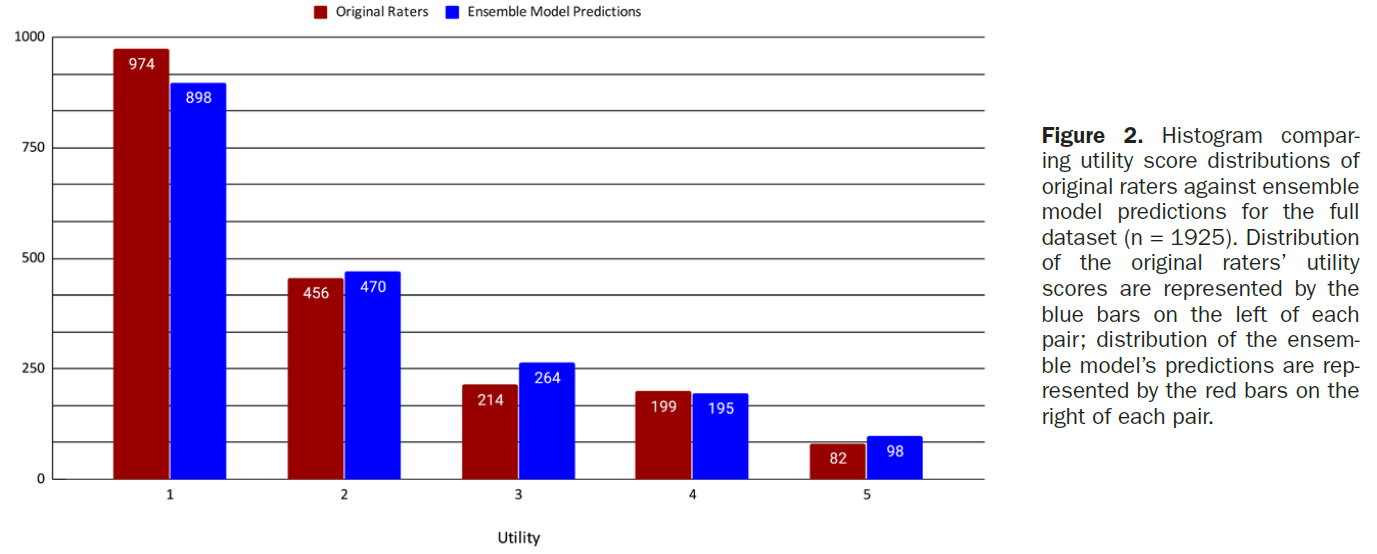
표 3은 앙상블 모델의 유용성 예측에서 추정된 유용성 범주 지정을 전체 데이터 세트의 원래 평가자와 비교한 것입니다. 유용성 범주 예측에 대한 전반적인 정확도는 82.1%였으며, 의견 불일치는 주로 모델이 코멘트을 유용성이 높은 것으로 분류할 때 발생했습니다. 특성이 더 정확하게 예측된 코멘트의 경우 유용성 범주 예측 정확도가 향상되었습니다.
Table 3 compares utility category designations as extrapolated from the ensemble model’s utility predictions compared to the original raters on the full dataset. Overall accuracy on utility category predictions was 82.1%; disagreement primarily occurred when our model classified comments as high-utility. Accuracy on utility category predictions improved for comments with more correct trait predictions.
모델에서
- 활용도가 높은 것으로 분류된 코멘트의 글자 수 중앙값은 499개, 사 분위수 범위는 389~693개, 총 범위는 119~1493개였으며,
- 활용도가 낮은 것으로 분류된 코멘트의 글자 수 중앙값은 159개, 사 분위수 범위는 60~220개, 총 범위는 4~736개였습니다.
활용도가 높은 예측과 낮은 예측의 범위가 겹친다는 것은 모델이 코멘트 길이만을 기준으로 활용도 분류를 지정하지 않았음을 보여주지만, 중앙값이 해당 사분위수 범위 내에 속하지 않는 것을 관찰했습니다.
Comments our model classified as
- high-utility had a median character count of 499, interquartile range of 389–693, and total range of 119–1493;
- low-utility classifications had a median character count of 159, interquartile range of 60–220, and total range of 4–736.
Overlapping ranges between high- and low-utility predictions show the model did not assign utility category based solely on comment length, although we observed the medians did not fall within their counterpart’s interquartile ranges.
피드백 품질 비교
Feedback Quality Comparison
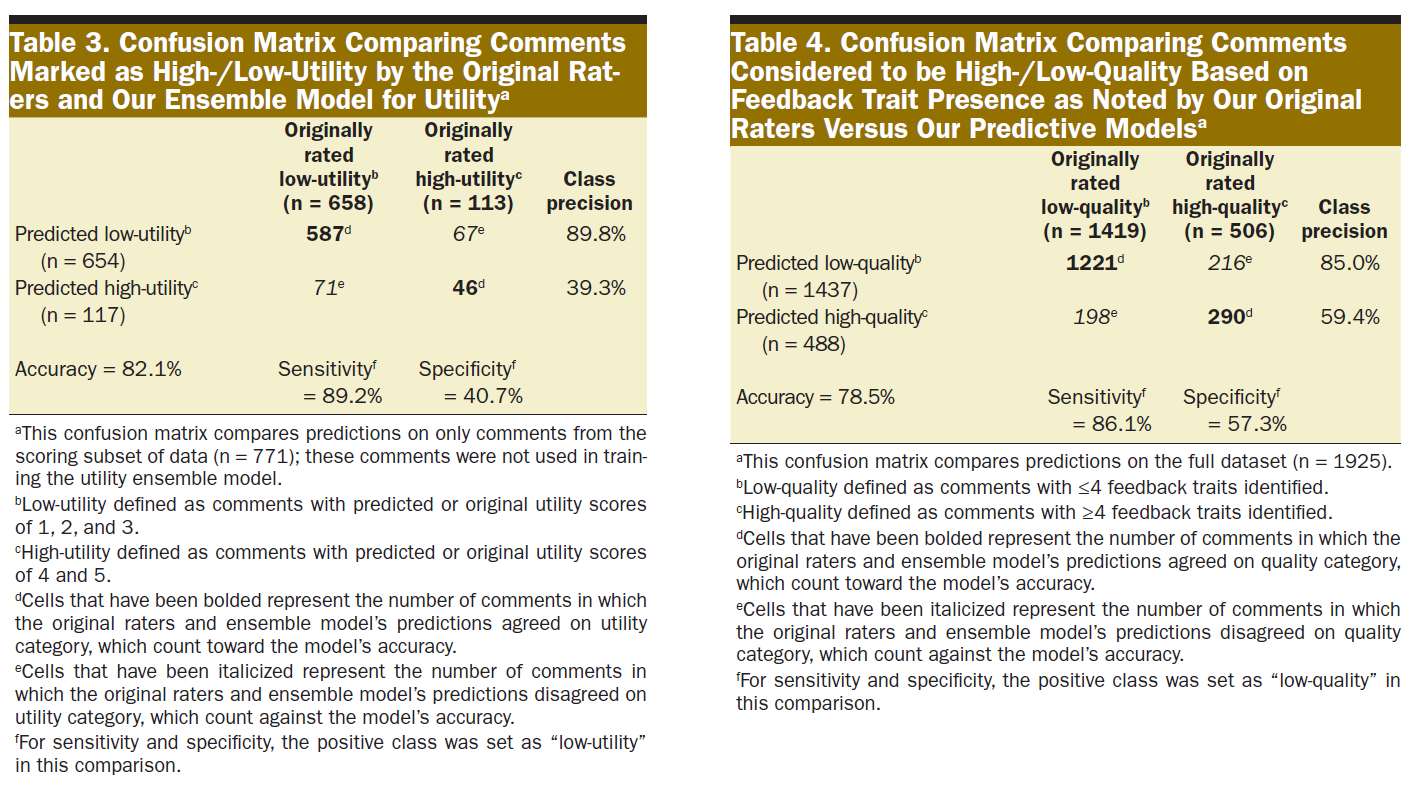
또한 코멘트 데이터에 모델을 적용하여 원래 평가자가 평가한 코멘트의 품질이 높거나 낮은 것으로 간주되는 코멘트을 예측 모델과 비교하여 피드백 품질을 평가했습니다. 표 4는 전체 데이터 세트에서 원래 평가자와 비교한 모델의 예측 결과를 보여줍니다. 피드백 품질 예측에 대한 전반적인 정확도는 78.5%였으며, 불일치는 주로 모델이 코멘트을 고품질로 분류할 때 발생했습니다.
Our models were also applied to the comment data to assess feedback quality by comparing comments considered to be high-/low-quality as scored by our original raters versus our predictive models. Table 4 displays the model’s predictions compared to the original raters on the full dataset. Overall accuracy on feedback quality predictions was 78.5%; disagreement primarily occurred when our model classified comments as high-quality.
모델 생성에 소요된 시간
Time Spent Creating Models
모든 모델은 ML에 대한 공식적인 배경 지식이 없는 연구 조교 한 명이 15~20시간에 걸쳐 만들었습니다. 여기에는 소프트웨어에 익숙해지고, 초기 프로토타입을 만들고, 문제를 해결하는 데 소요된 시간이 포함되었습니다. 시간의 상당 부분은 자동 모델에서 30분 기능 선택 설정으로 무감독 상태에서 모델을 생성하는 데 사용되었습니다. 이 프로그램은 데이터를 읽고, 모델을 적용하고, 몇 분 안에 예측을 생성했습니다.
All models were created in 15–20 hours by a single research assistant (M.J.C.), who did not have a formal background in ML. This included time spent becoming familiar with software, creating initial prototypes, and troubleshooting. A significant portion of time involved Auto Model generating models with our 30-minute feature selection setting while unsupervised. The program read data, applied models, and generated predictions within minutes.
토론
DISCUSSION
기존 피드백의 품질과 유용성을 평가하는 것은 향후 피드백을 개선하는 데 있어 매우 중요합니다. 일관되고 신속한 피드백 평가는 평가자 간 변동성을 줄이고 개입의 정량적 평가를 높여 교육 연구를 용이하게 합니다. ML을 사용하면 피드백 평가와 관련된 시간 문제를 해결할 수 있습니다. 예측 모델을 만들고, 이전에 채점된 코멘트를 분석하고, 모델의 성능을 분석하는 데 사용되는 이론과 소프트웨어에 익숙해지는 데는 초기 시간 투자가 필요합니다. 하지만 이러한 투자는 큰 결실을 맺을 수 있습니다. 숙련된 평가자가 200개의 코멘트을 신중하게 평가하는 데 2주 동안 누적 15시간이 걸렸습니다. 반면, 저희는 15~20시간 내에 수천 개의 코멘트을 단 몇 분 만에 평가할 수 있는 모든 예측 모델을 만들었습니다.
Assessing quality and utility of existing feedback is pivotal in improving future feedback. Consistent, rapid assessment of feedback facilitates educational research by reducing interrater variability and increasing quantitative assessment of interventions. Using ML can address time issues associated with feedback assessment. There is an initial time investment required to become familiar with the theory and software used to create predictive models, analyze previously scored comments, and analyze performance of models. However, this investment may result in great dividends. It took our experienced rater a cumulative 15 hours during 2 weeks to carefully assess 200 comments. In contrast, within 15–20 hours, we created all our predictive models that can evaluate thousands of comments in minutes.
ML을 활용하려면 모델 생성 및 해석을 이해하는 데 상당한 수준의 기술 전문 지식이 필요하다는 우려가 있을 수 있지만, 저희의 경험은 그렇지 않았습니다.19,20 공개 온라인 리소스에서 필요한 지식과 기술을 쉽게 습득할 수 있었습니다.1-3,21,22 5시간의 자기 주도 학습만으로도 이러한 작업을 수행하는 데 필요한 기본 개념을 익힐 수 있습니다. 이전에 검토된 1925개의 기존 피드백 코멘트를 사용하여 모델을 훈련하고 점수를 매겼습니다. 그러나 이러한 노력을 반영하고자 하는 교육자는 자체 모델을 생성하는 데 많은 코멘트가 필요하지 않습니다. 150개의 코멘트로 훈련된 이전의 유틸리티 예측 모델에서도 유사한 유틸리티 카테고리 예측 성능을 보였습니다. 이번 연구는 ML이 서면 피드백과 같은 정성적 데이터를 객관적으로 평가하기 위한 교육 연구와 같이 이전에 잘 알려지지 않은 영역에 적용될 수 있음을 보여줍니다. 교육 및 디브리핑 세션의 주제별 분석과 같이 의학교육 연구의 다른 텍스트 기반 데이터에도 유사한 모델을 적용할 수 있습니다.
While there may be concerns that utilizing ML requires significant levels of technical expertise to understand model creation and interpretation, this was not our experience.19,20 We were able to easily acquire requisite knowledge and skills from open online resources.1–3,21,22 Five hours of self-directed learning is sufficient to learn basic concepts needed to undertake these efforts. A preexisting bank of 1925 previously reviewed feedback comments was used to train and score models. However, educators wishing to mirror these efforts do not need as many comments to generate their own models; an earlier utility prediction model trained on just 150 comments resulted in similar utility category prediction performance. Our study illustrates that ML can be applied in previously underexplored areas, such as in education research to objectively assess qualitative data such as written feedback. Similar models could be applied to other text-based data in medical education research, such as thematic analyses of training and debriefing sessions.
ML을 사용하여 피드백 교육을 통해 혜택을 받을 수 있는 교수진을 식별하는 것이 목표이므로, 품질과 유용성이 낮은 피드백과 높은 피드백을 구분할 수 있는 임계값을 설정해야 합니다. 식별된 특성이 4개 이상인 경우 고품질, 점수가 4개 이상인 경우 높은 유용성에 대한 임계값을 결정한 것은 모든 평가자가 레지던트의 성장을 촉진하기 위해 탁월한 피드백을 남기기를 바라는 마음에서였습니다. 프로그램은 기관에 적합한 임계값과 생성된 예측의 용도를 고려해야 합니다.
With our goal of using ML to identify faculty who could benefit from feedback training, we inevitably must set a threshold to differentiate lower quality and utility feedback from higher. Decisions of thresholds for high-quality at ≥4 traits identified and high-utility at scores ≥4 were based on desiring all our evaluators leave exceptional feedback to promote resident growth. Programs should consider thresholds appropriate for their institutions and intended applications of generated predictions.
코멘트이 길수록 활용도가 높은 것으로 분류될 가능성이 높았지만, 활용도가 [높은 것으로 예측된 코멘트]와 [낮은 것으로 예측된 코멘트]의 글자 수 사분위수 범위가 겹치는 것에서 알 수 있듯이 길이가 활용도 범주를 결정하는 유일한 요소는 아니었습니다. 활용도 예측은 특성 존재 예측의 신뢰도 점수에서 생성되었으며, 이러한 신뢰도 점수는 코멘트 길이와 관련 단어 어간의 TF-IDF 점수 모두에 의해 생성되었습니다. 따라서 관련 단어 어간의 TF-IDF 점수가 충분히 높으면 짧은 코멘트도 특성이 있는 것으로 분류될 수 있고 그 반대의 경우도 마찬가지입니다. 그러나 코멘트 길이가 6개 특성 모델 중 5개 모델에서 가장 가중치가 높은 입력이라는 점과 활용도가 낮은 예측과 높은 예측의 문자 수 중앙값이 해당 사분위수 범위 내에 속하지 않는다는 점에서 알 수 있듯이 코멘트 길이는 여전히 주요 요인으로 작용했습니다.
While longer comments were more likely to be classified as high utility, length was not the sole deciding factor for utility category as evidenced by overlapping interquartile ranges of character count for comments predicted to be high and low utility. Utility predictions were generated from confidence scores of trait presence predictions, and those confidence scores were generated by both comment length and TF-IDF scores of relevant word stems. Therefore, if TF-IDF scores of relevant word stems were high enough, short comments could still be classified as having traits present and vice versa. However, comment length was still a major factor as evidenced by how it was the most heavily weighted input for 5 of 6 trait models, and how median character counts of low and high utility predictions did not fall within their counterparts’ interquartile ranges.
잠재적 응용 분야
Potential Applications
저희는 ML을 사용하여 피드백 배치를 주기적으로 검토하고 예측된 평가를 분석하여 교수진의 피드백을 개선하는 데 도움을 줄 수 있을 것으로 기대하고 있습니다.
- 이 도구는 많은 데이터를 신속하고 표준화된 방식으로 평가할 수 있기 때문에 피드백의 질에 초점을 맞춰 개입을 평가하는 연구 프로젝트에 유용할 수 있습니다.
- ML 피드백 평가의 더 즉각적인 활용은 양질의 피드백 제공에 대한 교수진 개발 및 교육을 지원하고 개입 대상을 식별하는 것입니다. 지속적으로 수준 이하의 피드백을 남기는 교수진은 자신의 피드백에 대한 보다 객관적인 검토를 받을 수 있으며, 이를 통해 피드백 기술을 개선하도록 유도할 수 있습니다.
- 또 다른 응용 분야로는 교수진이 입력 시스템에 피드백을 제출한 직후 예측 모델이 해당 코멘트에 점수를 매기는 방식에 대한 피드백 제출 후 즉시 보고서를 제공하는 것입니다.
- 마지막으로, 실시간 '피드백 지원' 도구를 전자 피드백 양식에 구현하여 교수진이 더 높은 활용도/높은 품질의 피드백을 작성할 수 있도록 지원할 수 있습니다. 이 프로젝트는 우리가 일반적으로 보아왔던 전통적인 수치 데이터 애플리케이션 외에도 텍스트 기반 및 주관적인 데이터 요소에도 ML을 적용할 수 있다는 희망적인 징후를 보여줍니다.
We envision using ML to assist periodic reviews of feedback batches, and analyzing the predicted assessments to improve faculty feedback.
- This tool can be helpful in research projects that focus assessing interventions on quality of feedback, as it allows rapid and standardized assessment of many pieces of data.
- A perhaps more immediately gratifying use of ML feedback assessment would be to assist in faculty development and education on providing quality feedback and identify targets for intervention. Faculty who are consistently leaving subpar feedback could receive a more objective review of their feedback that may be received more openly that may prompt improvement in feedback techniques.
- Another application could be providing faculty with an immediate postfeedback-submission report on how the predictive models would score the comment, immediately after submitting feedback in the entry system.
- Finally, a real-time “feedback assist” tool could be implemented in electronic feedback forms to help faculty craft higher utility/higher quality feedback. Our project offers promising signs that ML can also be applied to more text-based and subjective data points, in addition to the more traditional numerical data applications we typically have seen.
제한 사항
Limitations
최적의 기능 집합을 찾기 위해 수천 개의 모델을 생성하는 자동 모델 생성 프로세스에 상당한 시간이 소요되었습니다. 각 모델 생성에 대한 기능 선택을 위해 자동 모델을 임의로 30분으로 제한했습니다. 자동 모델은 컴퓨터의 리소스를 많이 사용할 수 있으므로 시스템 또는 소프트웨어 오류를 방지하기 위해 실행 중에는 컴퓨터가 프로그램에만 전념하도록 하는 것이 좋습니다. 모델링과 텍스트 처리는 자동 모델 없이도 Python이나 R과 같은 무료 프로그래밍 언어를 사용하여 수행할 수 있습니다.
Significant time was attributable to the Auto Model generation process, which created thousands of models to find optimal feature sets. We arbitrarily limited Auto Model to 30 additional minutes for feature selection for each model generation. Auto Model can be resource intensive on computers; we advise computers be solely dedicated to the program during runs to avoid systemic or software failure. Modeling and text processing can still be performed without Auto Model, and in free programming languages such as Python or R.
제한된 인구통계 정보만 수집했기 때문에 소수자나 취약 계층에 대한 모델의 의도치 않은 편향성을 평가할 수 없었습니다. 향후 피드백 분석 프로젝트에서는 모델 개발 과정에서 의도치 않게 발생할 수 있는 이러한 잠재적 편향성을 확인하기 위해 하위 그룹 분석을 모색할 계획입니다.
As we only collected limited demographics information, we could not assess for inadvertent biases of models with respect to minorities or vulnerable populations. In future feedback analysis projects, we aim to explore subgroup analyses to check for such potential biases that may inadvertently be developed during model development.
평가자가 코멘트을 '인위적으로' 길게 늘리거나 유행어를 사용하여 예측 모델을 속이려고 시도할 가능성이 있습니다. 이러한 가능성은 ML의 일반적인 문제입니다.23,24 그러나 피드백 샘플을 주기적으로 수동으로 검토하면 모델이 코멘트을 적절하게 분류하고 있는지 확인하여 이러한 시도를 방지할 수 있습니다. 이상적인 미래 모델은 코멘트 길이 대신 특징 단어의 TF-IDF 점수에 더 많이 의존함으로써 잠재적인 조작에 대해 더욱 강력해질 것입니다.
There is a possibility that evaluators could try to fool the predictive models by “artificially” lengthening their comments and using buzzwords; such a possibility is a general problem for ML.23,24 However, periodic manual reviews of feedback samples can safeguard against those attempts by verifying whether models are appropriately classifying comments. Ideally, future models will be more robust against potential manipulations by relying more on TF-IDF scores of feature words instead of comment length.
표 3에서 볼 수 있듯이, 앙상블 모델의 정확도 손실은 대부분 활용도가 높은 코멘트에 대한 예측에서 비롯되었습니다. 이 모델은 합산 일치도가 높은 코멘트에 대해 정확도, 민감도, 특이도가 더 높았지만, 합산 일치도와 관계없이 활용도가 높은 코멘트을 예측할 때 클래스 정밀도는 떨어지는 경향이 있었습니다. 향후 모델에서는 이러한 측면을 개선하고자 합니다. 한 가지 접근 방식은 인간 평가자를 예측 모델로 완전히 대체하는 대신, 예측 모델을 사용하여 표준 방식으로 대량의 피드백을 선별한 다음, 인간 평가자가 수동으로 선택적으로 재평가할 수 있는 하이브리드 접근 방식으로 ML을 사용하는 것입니다.
As seen in Table 3, most of the ensemble model’s loss in accuracy came from its predictions for high-utility comments. While this model had higher accuracy, sensitivity, and specificity for comments on which the sum concordance was higher, class precision when predicting comments to be high-utility tended to be poor regardless of sum concordance. We hope to improve on this aspect in future models. One approach is to use ML in a hybrid approach that uses our predictive models to screen large amounts of feedback in a standard way, which can then be selectively reassessed by human raters manually, rather than completely replace human raters with predictive models.
모델 성능을 개선할 수 있는 잠재적 방법
Potential Ways to Improve Model Performance
텍스트 처리 워크플로에서는 단어가 어떻게 사용되는지에 대한 문맥적 구분을 하지 않았습니다. 예를 들어, "계획을 직원에게 명확하게 전달했습니다"는 긍정적 피드백에서는 "전달하다"를 사용하는 반면, "계획을 직원에게 전달하는 것을 잊지 마세요"는 부정적 피드백에서 사용되는 단어를 나타냅니다. 또한 문법적 문맥을 구분하기 위해 품사별로 단어를 태그하지 않았습니다. 예를 들어 "환자를 주의 깊게 배치했습니다."와 "훌륭한 간호를 제공했습니다."에서 "간호"는 다르게 사용됩니다. 이로 인해 잘못된 예측이 발생할 수 있으며, 부정적인 피드백을 감지하는 것이 우려되는 영역입니다. 자연어 처리NLP 도구를 통합하면 단어가 어떻게 사용되는지 구별하는 데 도움이 되지만, 선택할 수 있는 특징feature의 수가 다양해지기 때문에 더 복잡한 모델을 생성해야 합니다. 특징 선택feature selection 은 모델 개발에 매우 중요하므로, 모델 성능을 향상시킬 수 있는 특징을 식별하는 동시에 모델 성능과 런타임을 악화시키는 관련 없는 특징을 제거할 수 있도록 텍스트 처리 접근 방식을 재평가해야 합니다. 또한 여러 센터에서 다양한 양식의 피드백을 통합하여 텍스트 셀에 긍정적인 피드백이나 부정적인 피드백을 기록하는 영역을 구분하지 않았습니다. 향후 피드백 검토에서는 '긍정적' 피드백과 '부정적' 피드백을 위한 별도의 텍스트 필드를 사용할 것입니다.
Our text processing workflow did not make contextual distinctions on how words were used. For example, “You clearly communicated your plan with the staff” uses “communicate” in positive feedback, whereas “Remember to communicate your plan with the staff” indicates the word used in negative feedback. Also, we did not tag words by part of speech to differentiate grammatical contexts. For example, “care” is used differently in “You carefully positioned patients” versus “You provided excellent care.” This can result in false predictions—with an area of concern being detecting negative feedback. Incorporating natural language processing tools would help distinguish how words are being used, but would require more complex model generation as the number of features to select from become more diverse. As feature selection is crucial to model development, we would have to reevaluate our text processing approach to ensure we strike a balance between identifying features that can improve model performance while removing irrelevant features that would only worsen model performance and runtimes. Additionally, we combined feedback from different forms from multiple centers, so the text cells did not separate areas to note positive feedback or negative feedback. In future feedback review, we would use separate text fields for “positive” and “negative” feedback.
훈련 데이터세트에서 관찰된 클래스 비율에 따라 비용/이득 값을 조정하여 클래스 불균형을 설명하는 간단한 방법을 사용했습니다. 비용 행렬은 알고리즘이 이득을 위한 최적의 모델을 결정하는 방법을 결정하므로, 비용 행렬을 설정하는 데 다른, 잠재적으로 더 복잡한 접근 방식을 사용하면 모델 성능이 크게 달라질 수 있습니다. 예를 들어,
- 유틸리티 비용 행렬을 조정하여 오분류에 대해 2점 이상 더 큰 불이익을 주면 잠재적으로 인간 평가자의 점수에 더 근접한 예측을 할 수 있습니다.
- 또한 다수majority 클래스에서 예시를 제거하는 다운샘플링이나 소수minority 클래스에서 무작위로 예시를 복제하여 강화하는 업샘플링과 같이 클래스 불균형을 해결하기 위한 다른 기법도 존재합니다.
We used a straightforward way of accounting for class imbalance by adjusting cost/gain values based on the class ratios observed in the training dataset. Cost matrices dictate how algorithms determine the optimal model for gains, so using a different, potentially more complex approach to setting the cost matrix could lead to vastly different model performance.
- For example, the utility cost matrix could be adjusted to more heavily penalize misclassifications by ≥ 2 points, potentially making predictions closer to the human raters’ scores.
- Additionally, other techniques to address class imbalance exist such as downsampling, which removes examples from majority classes, or upsampling, which duplicates random examples from the minority classes to reinforce them.
이러한 모델의 잠재적인 결함에도 불구하고 75% 이상의 코멘트이 6개 중 4개 이상의 특성에서 원래 평가자와 모델의 예측이 일치했습니다. 이러한 모델을 사용하여 피드백 품질을 예측한 결과, 품질이 낮은 피드백을 식별하는 민감도가 86.1%로 높았으며, 유용성 범주를 예측하는 앙상블 모델의 경우 유용성이 낮은 피드백을 식별하는 민감도가 89.2%로 높았습니다. ML에 대한 공식적인 배경 지식이 없음에도 불구하고 적은 시간을 투자하여 저품질/저유용성 피드백을 안정적으로 선별하는 모델을 생성할 수 있는 능력은 유사한 작업에 관심이 있는 다른 프로그램에도 영감을 줄 수 있을 것입니다. 고급 기술을 추가하면 성능이 향상될 수 있지만, 저희 모델은 이러한 기술을 추가하지 않고도 저품질(85.0%)/저유용성(89.8%) 코멘트을 예측하는 높은 수준의 정확도를 달성할 수 있었습니다. 따라서 특정 기간 동안 평가자가 모델에 의해 저품질/저유용성으로 표시된 코멘트의 비율이 높다면, 해당 평가자가 실제로 수준 이하의 피드백을 남기는 것은 아닌지 의심해 볼 수 있습니다.
In spite of the potential flaws in these models, more than 75% of comments had concordance on 4 or more traits out of 6 between the original raters’ and the models’ predictions. Using those models to predict feedback quality resulted in a high sensitivity for identifying low-quality feedback (86.1%), and the ensemble model for predicting utility category had high sensitivity for identifying low-utility feedback (89.2%). Our ability to generate models to reliably screen for low-quality/low-utility feedback with a modest time investment, despite not having formal backgrounds in ML, should encourage other programs interested in similar pursuits. While additional advanced techniques could improve performance, our models were still able to achieve a high class precision for predicting low-quality (85.0%)/low-utility (89.8%) comments without them. Therefore, if an evaluator has a high proportion of comments during a given span flagged as low-quality/low-utility by models, there would be reasonable concern about that evaluator truly leaving subpar feedback.
활용도가 높은 피드백을 분석하는 것은 레지던트 성과에 대한 개선 계획을 개발할 수 있는 중요한 가치가 있습니다. 활용도가 높은 피드백을 정확하게 식별하는 모델의 기능을 개선하는 것은 향후 연구해야 할 또 다른 영역입니다. 향후 모델의 반복 학습을 위해 활용도가 높은 피드백의 예를 더 많이 수집하면 성능이 향상될 수 있습니다.
There is significant value in analyzing high-utility feedback, which can develop improvement plans for resident performance. Improving our model’s ability to correctly identify high-utility feedback is another area for future investigation. Collecting more examples of high-utility feedback to train future iterations of the model may improve performance.
결론
CONCLUSIONS
ML 예측 모델링 접근 방식은 높은 민감도로 활용도가 낮은 피드백을 빠르게 식별하고 허용 가능한 민감도로 품질이 낮은 피드백을 빠르게 식별할 수 있었습니다. 이러한 발전은 피드백을 더욱 신속하게 평가하고 피드백의 유용성과 품질을 개선하기 위한 노력에 도움이 될 것입니다. 저희는 시간이 지남에 따라 이 모델을 개선하여 전 세계적으로 그리고 개별 교수진별로 피드백 제공의 유용성과 품질을 선별하고 평가하는 데 사용하는 것을 목표로 하고 있습니다.
A ML predictive modeling approach was able to rapidly identify low-utility feedback with high sensitivity and low-quality feedback with acceptable sensitivity. This advancement will allow for more rapid assessment of feedback and aid efforts to improve feedback utility and quality. We aim to enhance this model over time and use it to screen and assess the utility and quality of feedback provision, both globally and by individual faculty.
Using Machine Learning to Evaluate Attending Feedback on Resident Performance
PMID: 33323789
Abstract
Background: High-quality and high-utility feedback allows for the development of improvement plans for trainees. The current manual assessment of the quality of this feedback is time consuming and subjective. We propose the use of machine learning to rapidly distinguish the quality of attending feedback on resident performance.
Methods: Using a preexisting databank of 1925 manually reviewed feedback comments from 4 anesthesiology residency programs, we trained machine learning models to predict whether comments contained 6 predefined feedback traits (actionable, behavior focused, detailed, negative feedback, professionalism/communication, and specific) and predict the utility score of the comment on a scale of 1-5. Comments with ≥4 feedback traits were classified as high-quality and comments with ≥4 utility scores were classified as high-utility; otherwise comments were considered low-quality or low-utility, respectively. We used RapidMiner Studio (RapidMiner, Inc, Boston, MA), a data science platform, to train, validate, and score performance of models.
Results: Models for predicting the presence of feedback traits had accuracies of 74.4%-82.2%. Predictions on utility category were 82.1% accurate, with 89.2% sensitivity, and 89.8% class precision for low-utility predictions. Predictions on quality category were 78.5% accurate, with 86.1% sensitivity, and 85.0% class precision for low-quality predictions. Fifteen to 20 hours were spent by a research assistant with no prior experience in machine learning to become familiar with software, create models, and review performance on predictions made. The program read data, applied models, and generated predictions within minutes. In contrast, a recent manual feedback scoring effort by an author took 15 hours to manually collate and score 200 comments during the course of 2 weeks.
Conclusions: Harnessing the potential of machine learning allows for rapid assessment of attending feedback on resident performance. Using predictive models to rapidly screen for low-quality and low-utility feedback can aid programs in improving feedback provision, both globally and by individual faculty.
Copyright © 2020 International Anesthesia Research Society.
'Articles (Medical Education) > 교수법 (소그룹, TBL, PBL 등)' 카테고리의 다른 글
| 프로젝트 기반 학습과 연구 기반 학습(Higher Education Faculty Career Orientation and Advancement, Ch 8) (0) | 2023.08.04 |
|---|---|
| 자연어처리와 전공의 피드백 퀄리티의 질 평가 (J Surg Educ. 2021) (0) | 2023.07.19 |
| 인지과학의 인사이트를 임상 술기 교육에 사용하기: AMEE Guide No. 155 (Med Teach, 2023) (0) | 2023.07.04 |
| 보건의료전문직 교육에서 학생참여: AMEE Guide No. 152 (Med Teach, 2022) (0) | 2023.07.02 |
| 보건전문직교육에서 '알아채기': 관심을 줄 시간? (Med Educ, 2022) (0) | 2023.05.28 |