객관식 시험의 사후 분석 AMEE Guide No. 54 (Med Teach, 2011)
Post-examination analysis of objective tests
MOHSEN TAVAKOL & REG DENNICK

소개
Introduction
이 가이드의 목적은 의료 교육에서 객관적인 평가 결과를 분석하고 평가하는 데 관련된 이론적 근거와 프로세스의 개요를 제공하는 것이다. 객관적인 평가란
- 지식을 평가하는 객관식 질문 및
- 구체적이고 쉽게 측정할 수 있는 관찰 기준을 통해 임상 기술을 평가하는 객관적 구조화된 임상 검사(OSCE) 및 관련 평가(예: 절차적 기술의 직접 관찰(DOPS), 미니 임상 검사(mini-CEX))
The purpose of this Guide is to provide an overview of the rationale and processes involved in analysing and evaluating the results of objective assessments in medical education. By objective assessment we mean
- multiple choice questions that assess knowledge and
- objective structured clinical examinations (OSCEs) and related assessments (e.g., direct observation of procedural skills (DOPS), mini-clinical examination (mini-CEX)) that assess clinical skills by means of specific and easily measurable observational criteria.
결과적으로 우리는 성과에 대한 보다 주관적인 해석에 의존하는 에세이, 과제 또는 포트폴리오 기반 평가와 같은 자료를 배제하고 있다.
We are consequently excluding material such as essays, assignments or portfolio-based assessments which rely on more subjective interpretations of performance.
우리는 측정하기가 더 '쉬운' 사물을 측정하는 결과를 분석하는 데 집중하고 있으며, 따라서 편견에 대한 죄가 있다는 것을 인정한다. 객관적으로 측정하기 어렵기로 악명 높지만 매우 중요한 정서적 또는 태도 영역에서 의학 교육의 많은 학습 결과가 있다. 그럼에도 불구하고 지식 및 임상 기술의 객관적 시험은 의료 평가의 주요 요소이며 이러한 측정이 이루어지고, 분석되고, 평가되는 과정에 대한 이해는 현대 실무의 필수 요건이다. 많은 교과서와 논문이 이 중요한 분야를 다루었다.
We acknowledge that we are concentrating on analysing the results of measuring things which are ‘easier’ to measure and that therefore we are guilty of bias. There are many learning outcomes of medical education in the affective or attitudinal domains that are notoriously difficult to measure objectively but which are exceedingly important. Nevertheless the objective testing of knowledge and clinical skills is a major element of medical assessment and an understanding of the processes whereby these measurements are made, analysed and evaluated is an essential requirement of contemporary practice. A number of text-books and papers have covered this important area (Traub & Rowley 1991; Gilbert 1996; Anastasi & Urbin 1997; Hopkins 1998; Osterlind 1998; McAlpine 2002; Shultz & Whitney 2005; Crocker & Algina 2008; Holmbow & Hawkins 2008; Rust & Golombok 2009; de Champlain 2010; Cohen & Swerdlik 2010).
처음부터 우리는 객관적인 테스트가 개념적으로 일반적인 측정 원리와 관련된 심리측정이라고 불리는 측정의 한 형태라고 주장한다. 따라서 정확도, 신뢰성, 재현성, 유효성, 특수성 및 민감도와 같은 요소들은 모두 객관적인 측정 과정에 다양하게 적용될 수 있다. 이러한 요인의 통제는 [심리측정학이 모든 본질적인 변동성향을 가진 인간에게 적용된다]는 사실에 의해 더욱 중요해진다.
From the outset we assert that objective testing is a form of measurement, termed psychometrics, conceptually related to the principles of measurement in general. Consequently factors such as accuracy, reliability, reproducibility, validity, specificity and sensitivity can all apply in varying ways to the process of objective measurement. The control of these factors is made more important by the fact that psychometrics applies to human beings with all their intrinsic propensity for variation.
길이 또는 질량과 같은 물리적 특성은 매우 정확하게 측정할 수 있는 반면, 인간 학습의 측정은 상당한 변동과 '소음'과 관련이 있다. 또한 학습의 경우 [동질적인 실체]가 아닌 것이 분명하다. 전통적으로 (Bloom 1956년)은 인지적, 심리적, 정서적 영역으로 구분되며 각 영역 내에 더 많은 계층적 수준이 있다고 말했다. 이 가이드에서는 [객관식 질문에 의해 측정된 지식 영역]과 [OSCE에 의해 측정된 심리 운동 영역의 일부 측면]에 초점을 맞출 것이다.
A physical property such as length or mass can be measured extremely accurately whereas the measurement of human learning is associated with significant variation and ‘noise’. In addition, in the case of learning, it is clear that it is not a homogeneous entity. Traditionally (Bloom 1956) said that it is differentiated into the cognitive, psychomotor and affective domains with further hierarchical levels within each. In this guide we will concentrate on the knowledge domain as measured by multiple choice questions and some aspects of the psychomotor domain measured by OSCEs.
또 다른 분명한 점은 측정과 평가라는 용어가 종종 하나의 용어 바구니에 잘못 던져지는 경우가 많지만, 각각은 뚜렷한 의미를 가지고 있으며 서로 구별되어야 한다는 것이다.
- [측정]은 측정되는 현상의 크기를 평가하기 위해 [수치를 할당하는 과정]이다.
- 랄프 타일러에게 [평가evaluation]는 '교육목표가 어느 정도 실현되고 있는지를 결정하는 과정'을 의미한다(Tyler 1949).
- 수치지수numerical index를 입수하여 보고하는 것 자체는, 우리가 지수를 해석하고 평가하지 않는 한 의미가 없다(Morrow et al. 2006).
A further point of clarification is that although the terms measurement and evaluation are often mistakenly tossed into one terminological basket, each has a distinct meaning and should be differentiated from each other.
- Measurement is the process of assigning a numerical value in order to assess the magnitude of the phenomenon being measured.
- For Ralph Tyler, evaluation refers to ‘the process of determining to what extent the educational objectives are being realised’ (Tyler 1949).
- Obtaining and reporting a numerical index has no meaning in itself unless we interpret and value the index (Morrow et al. 2006).
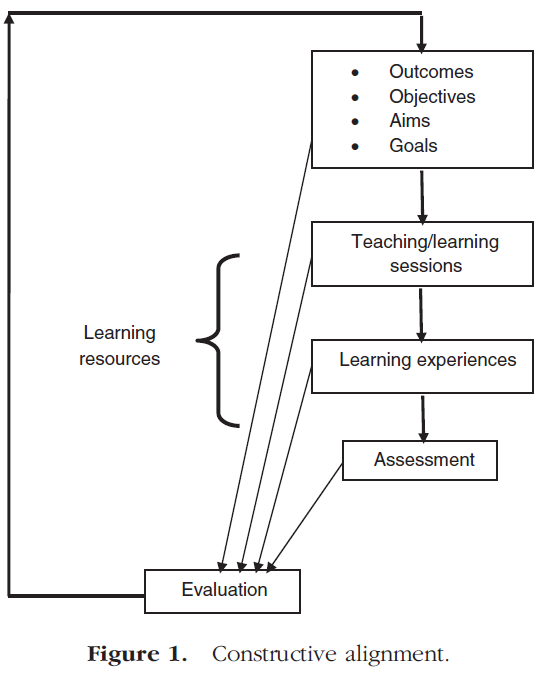
학습 측정은 고립된 사건이 아닙니다. 그것은 근본적으로 학습 요구의 식별에서 시작하여 예를 들어 의사, 간호사 및 기타 의료 전문가의 학습 결과로부터 시작하는 커리큘럼 주기의 일부이다. 그런 다음 이러한 학습 성과는 강의, 소규모 그룹 교육 또는 경험적 학습과 같은 가장 적절한 습득 방법에 대해 내린 결정의 기초가 된다. [학습의 측정] 또는 [평가]를 가지고 필요한 결과를 달성했는지 확인하는 것은 이 시점 이후입니다. 이 지점에서 [시험 후 분석]이 이루어지지만, 이것은 결과, 학습 및 평가의 커리큘럼 요소가 [커리큘럼 정렬]이라고 불리는 것에서 최적으로 표현되는지 여부를 확인하고자 하는 [커리큘럼 평가]의 전체 프로세스의 한 구성 요소일 뿐이다. 이 개념은 그림 1의 다이어그램으로 요약됩니다.
The measurement of learning is not an isolated event; it is fundamentally part of a curriculum cycle beginning with the identification of the learning needs and then the learning outcomes of, for example, doctors, nurses and other healthcare professionals. These learning outcomes then become the basis of decisions made concerning the most appropriate methods of acquisition, such as lecturing, small group teaching or experiential learning. It is after this point that the measurement of learning or assessment takes place to see if the required outcomes have been achieved. It is here that the subject of this guide, post-examination analysis, takes place but this is just one component of an overall process of curriculum evaluation that seeks to ascertain if the curriculum elements of outcomes, learning and assessment are articulated optimally in what has been termed curriculum alignment (Biggs & Tang 2007). This concept is summarised by the diagram in Figure 1.
커리큘럼 설계자와 교사는 [학습 성과에 대한 명확하고 집단적인 그림]을 가져야 한다.
- 그것들은 학생들이 학습 과정의 결론에 따라 [무엇을 배우고 입증할 것으로 예상되는지에 대한 진술]이며,
- 원칙적으로 [측정 가능]해야 하며
- 따라서 [객관적인 평가로 변환되고 운영]될 수 있어야 한다.
Curriculum designers and teachers should have a clear and collective picture of learning outcomes.
- They are statements of what students are expected to learn and demonstrate by the conclusion of the learning process and
- in principle they need to be measurable and
- hence capable of being transformed and operationalised into objective assessments.
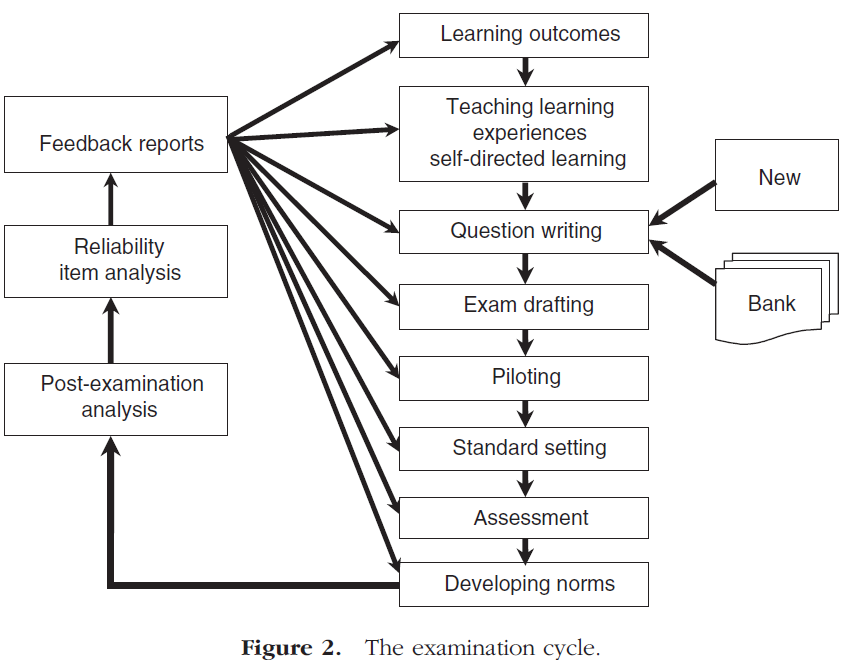
본 가이드는 평가에 의해 생성된 데이터를 분석하는 방법에 중점을 두지만, 이 데이터에서 얻은 정보가 학습, 교육 및 결과 사양의 프로세스로 되돌아간다는 것을 깨달아야 한다. 예를 들어, [시험에서 드러난 이상anomalies]은 잘못된 문제 설정, 잘못된 교육 또는 부적절한 학습 결과의 사양을 나타낼 수 있다. 평가 주기는 그림 2와 같이 도표로 표시할 수 있습니다.
Although this Guide will focus on the methods for analysing the data generated by assessments it must be realised that the information obtained from this data feeds back into the processes of learning, teaching and outcome specification. For example, anomalies revealed in tests might indicate poor question setting, poor teaching, or even the specification of inappropriate learning outcomes. The assessment cycle can be displayed diagrammatically as shown in Figure 2.
시험 주기
The examination cycle
본 가이드의 목적상, 우리는 학습 성과가 정의되었고 모든 학습자가 이러한 결과를 달성할 수 있도록 적절한 교육 및 학습 경험이 제공되었다고 가정할 것입니다. [학습 성과]와 관련된 용어를 둘러싼 논란이 여전히 존재한다. (학습) 성과는 학습 과정이 끝날 때 학습자가 요구하거나 달성한 역량을 설명하는 광범위한 진술이 되어야 합니다. 예를 들어, GMC, 스코틀랜드 학장 및 WFME에 의해 '결과' 기반 의료 커리큘럼이 정의되었다.
For the purposes of this Guide we will assume that learning outcomes have been defined and that appropriate teaching and learning experiences have been provided so that these outcomes can be achieved by all learners. There is some controversy still surrounding the terminology associated with learning outcomes. Outcomes are meant to be broad statements describing the competencies required or achieved by learners at the end of a course of study. For example ‘outcome’ based medical curricula have been defined by the GMC, Scottish Deans and the WFME (GMC 2003; WFME 2003; Scottish Dean 2007).
반면 '학습목표'는 보다 [세분화]되어, 강의와 같은 [특정 학습 에피소드의 마지막에 습득한 학습]을 설명하는 데 자주 사용된다. 세분화된 수준의 결과 또는 목표는 학습자가 무엇을 할 수 있어야 하는지를 설명하는 진술이다. 단순성을 위해 우리는 결과라는 용어를 내내 사용할 것이다.
‘Learning objectives’, on the other hand, are more granular and are frequently used to describe the learning that has been acquired at the end of a specific learning episode such as a lecture. Whatever level of granularity is specified outcomes or objectives are statements describing what learners should be able to do. For simplicity we will use the term outcomes throughout.
앞서 지적했듯이 학습 결과는 측정 가능해야 하므로 종종 [행동 성과]라고 합니다. 블룸(1956)은 행동 결과를 세 가지 영역으로 분류했다: 인지 영역, 정서 영역 및 정신 운동 영역.
- 인지적 또는 지식 내에서 도메인 결과는 증가하는 인지적 요구의 스펙트럼에 따라 분류될 수 있다. 블룸의 원래 순위는 지식, 이해, 응용, 분석, 종합, 평가로 구분되었다. 보다 최근에는 지식 차원이 업데이트되었다. 기억, 이해, 응용, 분석, 평가, 창조(Anderson & Krathwohl 2000).
- 원래의 심슨 1966년 사이코모터 영역은 관찰 프로토콜로 작동하기 쉽지 않은 일반적인 용어로 구성되었다: 인식, 설정, 유도 반응, 메커니즘, 복합적 공공적 반응, 적응 및 발생.
As previously pointed out, learning outcomes should be measurable and hence they are frequently termed behavioural outcomes. Bloom (1956) classified behavioural outcomes into three domains: the cognitive domain, the affective domain and the psychomotor domain.
- Within the cognitive or knowledge, domain outcomes can be categorised on a spectrum of increasing cognitive demand. Bloom's original ranking was differentiated into the following: knowledge, comprehension, application, analysis, synthesis and evaluation. More recently the knowledge dimension has been updated, giving the following: remembering, understanding, application, analysis, evaluation, creation (Anderson & Krathwohl 2000).
- The original psychomotor domain (Simpson 1966) consisted of general terms which were not easy to operationalise into an observational protocol: perception, set, guided response, mechanism, complex overt response, adaptation and origination.
Dreyfus 모델은 현재 실무 능력의 습득을 모니터링하는 데 널리 사용되고 있지만, 다시 말해 실무 절차를 평가하기 위한 객관적인 시스템으로 쉽게 전환되지 않는다. OSCE 스테이션에서 확인할 수 있듯이, 본질적으로 증가하는 정신운동 복잡성의 척도에 대해 개인을 측정하기보다는 쉽게 관찰할 수 있는 특정 실무 역량의 목록을 정의하는 데 중점을 둔다. 정서적 영역에서 결과를 측정하는 것은 정의된 행동을 관찰함으로써 달성되지만 기준은 종종 주관적이고 정의하기 어렵다. 관찰된 행동과 개인의 내면적 '태도' 사이의 관계도 문제가 있다.
The Dreyfus model (Dreyfus & Dreyfus 2000) is now widely used to monitor the acquisition of practical skills but again is not easily transformed into an objective system for assessing, for example, practical procedures. As will be seen methods for assessing at OSCE stations essentially revolve around defining a list of specific practical competencies that can be easily observed rather than measuring an individual against a scale of increasing psychomotor complexity. Measuring outcomes in the affective domain is achieved by observing defined behaviours but the criteria are often subjective and difficult to define. The relationship between observed behaviour and an individual's internal ‘attitude’ is also problematic.
시험
Test
시험은 '행동 표본의 객관적이고 표준화된 척도'로 정의되었다(Anastasi & Urbin 1997). 이 정의를 이해하기 위해서는 세 가지 핵심 요소, 즉 객관성, 표준화 및 행동의 표본이 명확해질 필요가 있다.
- 시험은 시험관의 주관적인 판단과 독립적으로 시행, 채점, 해석될 경우 [객관적인 것]으로 간주된다.
- [표준화된 시험]은 문제, 채점, 해석 및 관리에 대한 절차가 '한 시험관으로부터 다른 시험관에 이르기까지 획일적'인 시험이다. 이것은 단순히 우리가 학생들의 점수를 서로 비교하고 싶다면, 동일한 시험 조건에서 동일한 시험 문제를 가진 모든 학생들을 시험할 필요가 있다는 것을 보여준다.
- 시험은 [특정 행동의 표본]을 측정해야 한다. 이 표본을 바탕으로 검정 생성자는 몇 가지 추론과 가설을 도출합니다. 예를 들어, 의학 교육자가 학생들의 의학 용어에 대한 지식을 테스트하고 싶다면, 그 또는 그녀는 대표적인 의학 용어의 샘플로 그들의 성과를 조사한다.
Test has been defined as ‘an objective and standardised measure of a sample of behaviour’ (Anastasi & Urbin 1997). To understand this definition, three key elements need to be clarified, that is objectivity, standardisation and a sample of behaviour.
- A test is considered to be objective if it is administered, scored and interpreted independently of the subjective judgment of examiners.
- A standardised test is a test in which the procedure for the questions, scoring, interpreting and administrating are ‘uniform from one examiner and setting to another’ (Gregory 2007). This simply shows if we want to compare students’ scores to each other, it is necessary to test all students with the same test questions under the same test conditions.
- A test should measure a sample of particular behaviour. Based on this sample, test constructors draw some inferences and hypotheses. For example, if a medical educator wishes to test the knowledge of students’ medical terminology, he or she examines their performance with a representative sample of medical terms.
항목 작성 및 항목 뱅킹
Item writing and item banking
[학습 성과]가 정의되고 학생들이 학습 결과를 습득할 수 있도록 적절한 [학습 경험]이 제공되었다면, 다음 단계는 [시험 항목, 문제 또는 OSCE 점검 목록]의 작성이다. [문제 작성]은 잘못 구성된 항목이 평가 프로세스의 정렬을 전복시키고 손상시킬 수 있으므로 신중하게 개발되어야 하는 기술입니다. 질문은 인지 수준이 알려진 정의된 학습 결과와 관련되어야 하며 명확하고 모호하지 않아야 한다. 질문은 또한 타당해야 한다. 즉, 최소한 내용 타당성, 구성 타당성 및 안면 타당성, 즉 홉킨스(1998)에서 정의된 개념을 가져야 한다. 여기서 질문 작성 기술을 다룰 공간은 없지만 독자는 케이스와 스완슨에게 언급된다. 질문 개발자가 최종 초안에서 요구되는 것보다 2배 많은 질문을 생성한다면 유용할 것이다. 문제 개발자는 이러한 문제를 문제은행에 보관하여 나중에 시험에 대한 결정을 내릴 수 있다. 또한 시험 개발자는 병렬 형식의 신뢰성 추정(신뢰성 추정 참조)을 사용하여 신뢰성을 결정하기 위해 병렬 형식의 시험을 설계할 수 있다.
If learning outcomes have been defined and appropriate learning experiences provided so that students can acquire them, the next phase becomes the writing of test items, questions or OSCE check lists. Question writing is a skill that needs to be carefully developed as badly constructed items can subvert and damage the alignment of the assessment process. Questions should be related to a defined learning outcome whose cognitive level is known and they should be clear and unambiguous. Questions should also be valid, i.e. they should have at least content validity, construct validity and face validity, concepts defined in Hopkins (1998). There is not space here to go into the techniques of question writing but the reader is referred to Case and Swanson (Case & Swanson 2010). It would be useful if question developers produced twice as many questions as required in the final draft. Question developers can keep these questions in the question bank for later decisions on incorporation into the test. The test developer could also design parallel forms of the test in order to determine reliability by using parallel-forms reliability estimation (see reliability estimates).
질문 작성 외에도, 평가자들은 리즈 의학 교육 연구소(UMAP 2010)의 UMAP(Universities Medical Assessment Partnership)와 같은 많은 질문이 구축, 테스트, 평가 및 정제된 [문제 은행]으로 점점 더 눈을 돌리고 있다. 홍콩 이상 컨소시엄은 또한 국제적인 규모로 의학 교육자들을 위한 평가 은행을 설립하고 공유했다. 많은 질문의 장점은 평가자가 대상 내용 영역, 심리 측정 특성 또는 기타 독립 변수에 따라 분류되는 많은 시도되고 테스트된 질문에 편리하게 접근할 수 있다는 것을 의미한다. [문제 은행]은 컴퓨터에 저장하여 학생에게 전달된 질문이 이전 질문에 대한 수행의 함수인 컴퓨터 적응 테스트(CAT)에 사용할 수 있습니다(Weiss & Vale 1987).
In addition to question writing, assessors are increasingly turning to question banks where many questions have been constructed, tested and evaluated and refined, for example the Universities Medical Assessment Partnership (UMAP), at Leeds Institute for Medical Education (UMAP 2010). The Hong Kong Ideal Consortium has also created and shared an assessment bank for medical educators on an international scale (Ideal Consortium 2010). The advantage of a large bank of questions means that assessors have convenient access to a large number of tried and tested questions which are categorised according to the target content area, psychometric properties or other independent variables. Question banks can be stored in computers and used for computerised adaptive testing (CAT) where the question delivered to the student is a function of their performance on the previous questions (Weiss & Vale 1987).
CAT 접근 방식에서는 학생이 이전 질문에 올바르게 답하지 않을 경우 프로그램이 다음 질문으로 넘어가지 못하게 할 수 있습니다. 이는 기관이 지원자를 인증 또는 면허 취득 여부를 결정하는 형성 평가나 고부담 시험에서 매우 유용합니다. CAT는 시험 중 학생의 수행 수준을 측정하는 방식으로 작동한다. 각각의 질문이 끝난 후, 그의 현재 성과를 은행의 모든 질문과 비교할 수 있다. 전산화된 시험 프로그램의 알고리즘은 학생의 현재 성적 수준과 모든 시험 규격을 기반으로 은행의 다음 질문을 선택한다. 이 프로세스는 테스트가 종료될 때까지 계속됩니다. 이 방법으로 너무 쉬우거나 너무 어려운 문제는 해당 응시자에게 전달되지 않고 시험이 개인화됩니다. CAT를 사용하면 신뢰성에 영향을 주지 않으면서 관리해야 하는 시험 문제 수가 50% 감소하고 오류 측정도 50% 감소합니다.
In this approach the programme may not allow the student to move on to the next question, if he or she does not correctly answer the previous question. This is very useful for formative assessment or in high stakes examinations, where institutions are deciding if a candidate will be certified or licensed (Bergstrom & Lunz 2008). CAT operates by measuring the performance level of the student during the test. After each question, his/her current performance can be compared to all questions in the bank. The algorithm of the computerised testing programme selects the next question from the bank based on the current level of the student's performance and all test specifications. This process continues until the test is terminated. By this method the questions that are too easy or too difficult will not be delivered to that candidate and the test will be individualised. Using CAT, the numbers of test questions that need to be administrated are reduced by 50% without sacrificing reliability and concurrently the measurement of error is reduced by 50% (Bergstrom & Lunz 2008; Cohen & Swerdlik 2010).
항목 샘플링: 몇 가지 질문을 해야 합니까?
Item sampling: how many questions should we ask?
우리가 시험을 칠 때, 학습 영역의 모든 학습 결과와 관련된 질문을 하는 것은 현실적으로 불가능하며, 결과적으로 우리는 실용적인 이유로 샘플을 채취해야 한다. 그러나, 특정 지식의 영역이 영역의 적절한 깊이와 폭을 포괄하는 학습 결과의 범위에 의해 설명되었다면, 이러한 학습 결과의 몇 부분이 전체 모집단의 대표적인 샘플을 구성합니까? 다시 말해서, 우리는 시험에서 얼마나 많은 항목을 정해서 한 학생을 위해 얻은 점수가 그들의 세계적인 지식을 반영한다는 것을 우리에게 안심시켜야 하는가? 많은 시험들의 크기가 적절한 표본 크기보다는 전통이나 시간의 길이에 기반을 두고 있기 때문에 이것은 자주 묻는 질문이 아니다. 이 문제를 해결함으로써 생성된 유효성은 내용 타당도와 연관된다.
When we set an exam it is practically unfeasible to ask a question concerned with every single learning outcome in an area of learning, consequently we are forced to sample for practical reasons. However, if a particular area of knowledge has been described by a range of learning outcomes, which cover an appropriate depth and breadth of the domain, what fraction of these learning outcomes constitutes a representative sample from the total population? In other words how many items should we set in the test to reassure us that the score obtained for a student reflects their global knowledge? This is a question that is not often asked as the size of many exams is based on tradition or length of time rather than appropriate sample size. The validity created by addressing this issue is associated with content validity.
전체 항목 풀의 대표적인 부분을 선택하는 과정을 문항 샘플링이라고 한다. 시험의 항목 크기는 오류의 원인이 될 수 있으며 오류는 나중에 논의될 것처럼 신뢰성이 떨어진다(Cortina 1993). 그러나 시험 항목의 수가 증가함에 따라 표본 오차가 감소하여 신뢰성이 그림 3과 같이 증가해야 한다는 것은 분명하다. 또한 추측 가능성이 있는 객관식 시험에서 항목 수를 늘리면 추측과 관련된 오차가 줄어듭니다.
The process of selecting a representative fraction of a total pool of items is referred to as item sampling. The size of items in a test can be a source of error and error leads to unreliability as will be discussed later (Cortina 1993). However, it is clear that as the number of test items increases sampling error will decrease and hence reliability should increase as shown in Figure 3. In addition, in multiple choice tests where there is the possibility of guessing, increasing the number of items will reduce errors associated with guessing.

아래 공식을 사용하여 검정에 적합한 표본 크기를 계산할 수 있습니다.
An appropriate sample size can be calculated for a test using the formula below:

여기서 n은 표본 크기와 같으며, Z2는 표본 크기가 우연에 의해 얼마나 영향을 받는지 나타내는 신뢰 수준(90% 신뢰도는 1.64, 95% 신뢰도는 1.96, 99%는 2.57)이며, SD는 항목 모집단의 표준 편차 추정치이며, e2는 표본 크기의 오차(예: 0.03 또는 0.05)입니다. 따라서 표본 크기를 계산하려면 파일럿 연구 또는 이전 데이터에서 추정된 표준 편차가 필요합니다. 예를 들어, 문항 모집단에서 20문항의 무작위 표본을 추출하여 학생 그룹과 함께 시험하는 경우, 학생 점수의 표준 편차는 0.26으로 계산될 수 있다. 그런 다음 이 표준 편차를 표본 크기 공식에 대입하고 필요한 표본 크기를 계산합니다. 이 정보를 가지고 95% 신뢰 수준과 0.05 정밀도의 표본을 얻으려면 필요한 표본 크기(n)는 다음과 같이 계산됩니다.
Where n is equal to the sample size, Z2 is a confidence level indicating how much the sample size is influenced by chance (1.64 for 90% confidence, 1.96 for 95% and 2.57 for 99%), SD is an estimation of standard deviation in the population of items, e2 is the error of the sample size, e.g., 0.03 or 0.05. To calculate the sample size we therefore need the standard deviation estimated either from a pilot study or from previous data. For example if a random sample of 20 questions is drawn from the population of items and piloted with a group of students a standard deviation of student's scores might be calculated as 0.26. This standard deviation is then substituted into the sample size formula and the sample size required is calculated. With this information in hand, if we desire to obtain a sample with a 95% confidence level and 0.05 precision, the sample size required (n) is calculated as:
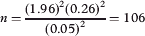
따라서 95% 신뢰도를 제공하기 위해 최소 106개 문항이 시험에 포함되어야 합니다. 시험 대상 항목 모집단의 이질성이 클 경우, 주어진 수준의 정밀도를 얻기 위해서는 더 큰 표본이 필요하며, 그 반대의 경우도 마찬가지라는 점에 유의해야 한다. 이질적인 테스트가 많을수록 나중에 논의된 크론바흐 알파 통계에 의해 결정되는 항목 간 일관성이 떨어진다.
Therefore, the test should include at least 106 questions to provide 95% confidence. It should be noted that if the heterogeneity of the population of items being tested is large, a larger sample is required to obtain a given level of precision and vice versa. The more heterogeneous a test, the less inter-item consistency there is as determined by the Cronbach alpha statistic as discussed later.
평가의 파일럿
Piloting of assessments
원칙적으로 시험이 개념화되고 구성되면 항목 분석을 사용하여 전체 내용 문제를 제거하기 위해 적절한 학습자 그룹을 대상으로 시험해야 합니다. 실제로 통계 절차는 '좋은' 질문과 수정하거나 폐기해야 하는 질문을 판단하는 데 도움이 됩니다. 이 분석을 바탕으로 시험 문제를 만들고 새로운 수험생 표본에 시험하여 시험을 마무리한다. 그러나 실제로 이 과정은 시험 내용이 학생에게 '유출'될 수 있고, 문제 은행의 좋은 문제를 다 사용할 수 있기 때문에 실현 불가능할 수 있습니다. 대안적 또는 추가적인 접근법은 문제의 용이성, 난이도 또는 적절성에 대한 귀중한 조언을 해줄 수 있는 외부 심사관이 시험지를 볼 수 있도록 하는 것이다. 또 다른 고려사항은 아래에서 논의되는 병렬 형식의 시험 사용이다.
In principle, once an examination has been conceptualised and constructed it should be piloted on an appropriate group of learners to eliminate any gross content problems using item analysis. Indeed, statistical procedures assist us to judge ‘good’ questions and those questions that need to be modified or discarded. On the basis of this analysis, test questions are created and tried out on a new sample of examinees to finalise the test. However, in practice this process may be unfeasible as it might allow ‘leakage’ of the exam content into the student body and might use up valuable questions from the bank. An alternative or additional approach is to ensure that the exam paper is seen by an external examiner who can give valuable advice on the ease, difficulty or appropriateness of questions. Another consideration is the use of parallel-forms of the test, which is discussed below.
표준설정
Standard setting
시험지를 사용할 준비가 되면 '표준 설정'으로 합격 표시를 결정해야 합니다. 간단히 적절한 개인 그룹은 대상 청중과 관련하여 각 질문의 용이성 또는 난이도를 차례로 검토하고, [주관적인 합의 과정]을 통해 (필기 시험과 임상 시험 모두에 대해) [신뢰할 수 있고 정당하며 허용되는 합격선 점수]를 설정한다. 표준은 허용 가능한 수행자와 그렇지 않은 수행자 사이의 경계를 나타내는 최소 적정 수준의 수행이다(Norcini 2003). 문헌에 설명된 표준 점수 식별에 사용할 수 있는 여러 가지 표준 설정 방법이 있지만 이 가이드의 목적은 아닙니다.
Once the exam paper is ready for use a pass-mark needs to be determined by ‘standard setting’. Briefly a group of appropriate individuals examines each question in turn for its ease or difficulty in relation to its target audience and, via a subjective process of consensus, establishes trustworthy, justifiable and acceptable standard scores for both written tests and clinical examinations. The standard is the minimum adequate level of performance, indicating the boundary between those who perform acceptably and those who do not (Norcini 2003). There are a number of different standard setting methods available for identifying the standard score, described in the literature (Cusimano 1996, Norcini & Guille 2002; Bandaranayake 2008), but it is not the purpose of this Guide to discuss them.
그러나 여기서 중요한 것은 [시험 후 분석 결과]를 [표준 설정과 관련된 사람들에게 피드백]하여, 문항의 속성과 품질을 평가하는 능력을 향상시킬 수 있는 수단이다. 표준 설정자는 시험의 용이성이나 난이도에 대해 더 많은 정보에 입각한 판단을 내릴 수 있도록 [문항과 전반적인 시험 구성]에 대한 지식과 경험을 쌓아야 하며, 따라서 더 공정하고 적절한 합격점수 또는 컷 점수를 정의할 수 있어야 한다.
However, what is relevant here is the means by which the results of post-examination analysis can be fed back to those involved in standard setting so that their ability to evaluate the attributes and quality of questions is enhanced. Standard setters need to build up a body of knowledge and experience of items and overall test construction so that they can make more informed judgements concerning the ease or difficulty of a test and hence define a fairer and more appropriate pass mark or cut-score.
표준 참조 및 기준 참조 테스트
Norm referenced and criterion referenced tests
이것이 포함된 문항의 수와 유형에 영향을 미치고 따라서 검사 후 분석의 해석에 영향을 미치기 때문에 고려해야 할 마지막 주제는 시험의 전반적인 목적이다. 테스트를 구성하는 두 가지 주요 목적은 로버트 글레이저가 만든 용어인 표준 참조와 기준 참조를 위한 것이다.
One final topic that needs to be considered is the overall purpose of the test since this will affect the number and type of questions it contains and hence will influence the interpretation of post-examination analysis. The two major purposes for constructing tests are for norm-referencing and criterion referencing, terms coined by Robert Glaser (Glaser 1963).
[norm-referenced 접근법]에서 시험 설계자는 경쟁적인 이유 또는 특정 표준을 유지하기 위해 미래 과정의 제한된 장소와 같은 특정 이유로 최고의 학생을 선발하기 위해 성적이 우수한 학생과 성적이 낮은 학생을 구별하려고 한다. 시험이 끝날 때 시험 제작자들은 학생들의 시험 점수의 평균과 표준 편차를 계산한 다음 정규 분포 곡선에서 각 학생의 위치를 결정한다. 합격이 허용된 학생의 비율과 다른 성적을 가진 학생들의 places의 가용성에 따라 임의의 성적 경계와 합격 표시가 이 분포에 삽입된다. 분명히 표준 기준 시험에서 [학생이 얼마나 잘하느냐]는 학생의 성취도에 대한 절대적인 척도가 되기보다는, 전체 코호트가 어떻게 수행하느냐의 함수이다. 만약 시험의 목적이 제한된 포지션이나 시상을 위한 경쟁이라면, 정규 분포를 따라 [학생들을 분산시키기 위해] norm-referenced 시험을 설계해야 한다. 따라서 지식기반시험에서는 [이질적인 인지적 요구]를 가진 문항이 있는 것이 적절할 것이며, 검사후 분석은 그러한 시험이 목적을 달성했는지 여부를 확인할 수 있을 것이다.
In norm-referenced approaches, test designers seek to differentiate high-performing students from low-performing ones in order to select the best students for particular reasons, such as a limited number of places on future courses, for competitive reasons or to maintain particular standards. At the conclusion of the examination test makers calculate the mean and standard deviation of students’ test scores and then determine the placement of each student on a normal distribution curve. Arbitrary grade boundaries and pass-marks are inserted onto this distribution depending on the proportion of students that are permitted to pass and the availability of places for students with different grades. Clearly how well a student does in a norm-referenced exam is a function of how the whole cohort performs rather than being an absolute measure of the student's attainment. If the purpose of the exam is competition for limited places or prizes then a norm-referenced exam should be designed to spread students out along the normal distribution. Thus, in a knowledge based exam it would be appropriate to have a range of questions with heterogeneous cognitive demand and post-examination analysis would be able to confirm whether such an exam achieved its aim.
[Criterion-referenced 접근법]은 다른 사람의 성과에 대한 참조 없이 학습자의 성취도를 측정하여 학습자를 평가하려고 시도한다. Cohen과 Swerdlik(2010)에 따르면, Criterion-referenced 평가는 '평가방법 및 정해진 기준에 따라 개인의 점수를 평가하여 시험점수에서 의미를 도출하는 방법'으로 정의된다. 따라서 학생이 특정 학점을 합격, 불합격 또는 달성하는지 여부는 코호트의 달성 여부에 관계없이 시험에서 특정 점수를 달성할 수 있는 능력에 따라 결정된다. 기준 참조는 시험의 주요 목적이 학생들이 특정한 인지 능력이나 정신 운동 능력을 획득했는지 확인하는 것일 때 사용된다. 이는 질문의 수와 유형에 영향을 미칠 것이 분명하며, 따라서 Criterion-referenced 시험이 [더 동질적]일 가능성이 높다. 그럼에도 불구하고 학습자 모집단 내 능력 범위와 질문의 잔류 이질성을 고려할 때, Criterion-referenced 시험에서도 분산은 적지만 결과가 분석될 때 정규 분포가 관찰될 가능성이 여전히 높다.
Criterion-referenced approaches attempt to assess learners by measuring their attainment without reference to the performance of others. Criterion-referenced assessment, according to Cohen and Swerdlik (2010), is defined as ‘a method of evaluation and a way of deriving meaning from test scores by evaluating an individual's score with reference to a set standard’. Thus, whether a student passes or fails or achieves a particular grade is determined by their ability to achieve a particular score in an examination regardless of the attainment of the cohort. Criterion-referencing is used when the primary purpose of an examination is to see if students have attained specific cognitive or psychomotor competencies. Clearly this will influence the number and type of questions asked and it is more likely, therefore, that a criterion-referenced exam would be more homogeneous. Nevertheless given the range of abilities within a population of learners and the residual heterogeneity of questions, even in a criterion-referenced exam, it is still likely that a normal distribution will be observed when the results are analysed, albeit with less variance.
시험문제 분석
Analysis of examination questions
[시험 후 분석기법]을 활용하는 근거는 [평가의 질과 신뢰성을 향상]시키고, 작은 분산오차로 학생들의 수행수준을 추정하기 위해 학생을 평가하는 데 [가장 적합한 문항을 선택]하기 위함이다. 이 섹션에서는 결함이 있는 질문을 식별하기 위해 다양한 프로세스를 사용할 수 있는 방법, 차별을 개선할 수 있는 방법 및 질문을 삭제하거나 바꿔서 전체적인 신뢰성을 높일 수 있는 방법을 설명합니다. OSCE 시험의 경우 '매'와 '비둘기'의 식별과 평가자 간 신뢰성 문제를 다루는 문제가 논의될 것이다.
The rationale for using post-exam analysis techniques is to improve the quality and reliability of assessments, and to select the questions that are most appropriate for assessing students in order to estimate students’ level of performance with low variance error. This section will explain how various processes can be used to identify flawed questions, how discrimination can be improved and how overall reliability can be increased by deleting or rephrasing questions. In the case of OSCE examinations the identification of ‘hawks’ and ‘doves’ and the problem of dealing with inter-rater reliability issues will be discussed.
또한 시험 후 분석이 항목 은행의 메타 데이터 코딩 문제 개발에 어떻게 기여할 수 있는지, 예를 들어 표준 설정의 정확도를 향상시킴으로써 문제 데이터가 시험 주기에 어떻게 영향을 미칠 수 있는지 논의할 것이다.
In addition we will discuss how post-exam analysis can feed into the development of meta-data coded questions in item banks and how question data can influence the examination cycle by, for example, improving the accuracy of standard setting.
조정
Moderation
보다 분석적인 방법을 다루기 전에 [시험 조정 과정]에 대해 간략하게 논의할 가치가 있습니다. 이는 반드시 매우 객관적인 평가 기준을 사용하지 않는 평가자가 여러 명인 상황에서 필요할 가능성이 높다. 이 문제는 기계나 컴퓨터에 표시된 지식 기반 평가에서는 발생하지 않지만 사람이 평가한 OSCE 검사에서는 발생할 수 있다. 특히 주관성이 시험 채점에 관여할 때, 평가 기준('매'와 '비둘기')을 차등적으로 해석하는 심사관은 오류 분산의 원천이 될 수 있으며, 이는 다시 측정되는 성과에 대한 학생의 실제 점수에 부정적이거나 긍정적인 영향을 미칠 수 있다. 이는 또한 저신뢰성unrealiability을 유발하며, 이 요인을 보완하기 위한 메커니즘을 마련해야 한다(나중에 참조). 논술이나 단답형을 이용한 필기시험의 경우, 이중, 익명의 채점이 공정한 기준이 유지되도록 하는 가장 좋은 방법인 경우가 많다.
Before dealing with the more analytical methods it is worthwhile briefly discussing the process of exam Moderation. This is more likely to be required in situations when there are multiple assessors who are not necessarily using very objective assessment criteria. This is unlikely to occur with machine or computer marked knowledge based assessments but can occur with human assessed OSCE examinations. Examiners, especially when subjectivity is involved in test scoring, who differentially interprets assessment criteria (‘hawks’ and ‘doves’) can be source of error variance, which in turn may negatively or positively influence the student's true score on the performance being measured. This will also generate unreliability and mechanisms need to be in place to compensate for this factor (see later). For written examinations using essays or short answers, double, anonymous marking is often the best way to ensure that fair standards are maintained.
기술 통계량
Descriptive statistics
테스트에서 원시 점수를 얻은 후 가장 간단한 분석은 점수의 빈도 분포를 살펴보고 평균, 최빈값, 중위수 및 표준 편차를 계산하는 것입니다. 이 수치는 SPSS(SPSS 2009)에 데이터를 삽입하여 쉽게 계산할 수 있다. 일반적으로 사용되는 용어의 정의는 표 1에 설명되어 있습니다.
Once raw scores have been obtained from a test the simplest analysis that can be undertaken is to look at the frequency distribution of scores and to calculate the mean, the mode, the median and the standard deviation. These figures are readily calculated by inserting the data into SPSS (SPSS 2009). The definitions of the commonly used terms are described in Table 1.

분포를 검사하면 분포가 '정규' 분포에서 얼마나 멀리 떨어져 있는지, 얼마나 치우쳐 있는지 알 수 있습니다. 평균, 모드 및 중위수 간의 차이는 분포가 정규 분포를 얼마나 벗어나는지 보다 객관적으로 나타냅니다. 분포가 치우쳐 있는 정도는 검정의 전반적인 용이성 또는 난이도를 나타낼 수 있습니다. 모드가 한쪽으로 꺼지면 분포가 치우쳐 있다고 합니다. 모드가 왼쪽이고 꼬리가 오른쪽인 경우 분포는 양의 또는 오른쪽 왜도를 갖습니다. 이는 학생들의 시험 점수가 분포의 높은 끝에서 떨어지는 경우가 거의 없다는 것을 보여주는데, 이는 시험이 너무 어려웠다는 것을 의미한다. 여기서 분포의 하단에서의 변별력을 수정하기 위해서는 난이도가 낮은 문항이 더 많이 사용되었어야 했다. 긴 꼬리가 왼쪽에 있으면 분포가 음수 또는 좌측 스큐를 갖습니다. 이는 학생들의 시험 점수가 분포 하단에서 떨어지는 경우가 거의 없다는 것을 보여주는데, 이는 시험이 너무 쉬웠다는 것을 의미한다. 여기서 분포의 상위 끝에서의 차별을 수정하기 위해 더 어려운 질문이 사용될 수 있었다.
Inspection of the distribution can reveal how far it deviates from a ‘normal’ distribution and how skewed it is. Differences between the mean, mode and median also give a more objective indication of how much the distribution deviates from normal. How skewed the distribution is can indicate the overall ease or difficulty of a test. When the mode is off to one side the distribution is said to be skewed. If the mode is to the left with a long tail to the right the distribution has positive or right skewness. This shows that few students’ test scores fall at the high end of the distribution, which means the test was too difficult. Here, in order to modify the discrimination at the lower end of the distribution, more questions with a lower level of difficulty should have been used. If the long tail is to the left the distribution has negative or left skeweness. This shows that few students’ test scores fall at the lower end of the distribution, which means the test was too easy. Here, in order to modify the discrimination at the higher end of the distribution, harder questions could have been used.
Z점수
Z-scores
원시 점수의 평균과 표준 편차는 시험의 크기와 총점에 따라 달라집니다. 시험 점수를 표준 방식으로 비교할 수 있도록 '정규화'하는 방법은 z-점수를 계산하는 것이다.
The means and standard deviations of raw scores will vary depending on the size of the examination and the total mark. A method for ‘normalising’ examination scores so that they can be compared in a standard way is to calculate z-scores.
만약 학생들의 점수가 평균과 표준 편차를 가지고 있다면, 학생의 점수는 다음과 같은 방정식에 의해 z-점수로 변환된다.
If students’ scores have a mean and standard deviation, then the student's score is transformed into a z-score by the equation:

이 공식은 단순히 z-점수가 특정 시험에서 학생들의 원시 점수(X)와 평균 점수(X_bar)의 차이와 같다는 것을 보여준다. 모든 z-점수 변환 분포의 평균은 0이고 표준 편차는 1입니다. 개인의 z 점수는 표준 편차 단위로 평균보다 얼마나 높거나 낮은지 보여줍니다. 예를 들어 특정 시험의 점수 평균이 표준 편차 15에 50이라고 가정하면 학생이 65점을 받으면 z 점수는 +1이다. 이것은 학생이 분포의 평균보다 +1 표준 편차라는 것을 의미합니다. 학생의 위치를 서로 비교하는 데 z-점수의 표준 표를 사용할 수 있습니다. 정규 분포 내에서 점수의 위치는 다음과 같습니다. 점수의 68%는 평균의 +/-1 표준 편차 내에 있습니다. 점수의 95%는 평균의 + /-2 표준 편차 내에 있습니다. 마지막으로, 점수의 99.75%는 평균의 +/-3 표준 편차 내에 있습니다. 따라서 위의 예에서 다른 학생의 약 16%가 학생보다 높은 점수를 받았습니다. 따라서 원점수에 의존하는 것은 학생들에게 잘못된 인상을 줄 수 있을 뿐만 아니라 시험에 대한 왜곡된 시각을 제공할 수 있다. Z 점수는 교사들이 다른 총점으로 다른 시험에서 학생들의 점수를 비교할 수 있게 해준다.
This formula simply shows that a z-score is equal to the difference between a raw score (X) and the mean score of students (X_bar) in a particular test divided by the standard deviation (s). All z-score transformed distributions have a mean of 0 and a standard deviation of 1. An individual's z-score shows how far above or below the mean their score is in units of standard deviation. For example assuming the mean of scores in a particular test is 50 with a standard deviation 15, if a student scores 65, his/her z score is +1. This means that the student is +1 standard deviation above the mean of the distribution. Standard tables of z-scores are available for comparing the position of student to each other. Within the normal distribution the position of scores is as follows: 68% of scores lie within +/−1 standard deviation of the mean. 95% of scores lie within + /−2 standard deviations of the mean. Finally, 99.75% of the scores lie within +/−3 standard deviations of the mean. Therefore, in the above example, approximately 16% of other students obtained higher scores than the student. Thus, relying on a raw score can provide a wrong impression of the student, as well as a distorted view of the exam. Z-scores allow teachers to compare students’ scores on different tests with different total marks.

문항 분석
Item analysis
시험 결과의 문항 분석은 정량적 방법을 사용하여 어떤 문제를 채택해야 하는지, 어떤 문제를 수정해야 하는지, 어떤 문제를 폐기해야 하는지 판단하는 데 도움이 된다. 문항 분석은 개별 문항과 글로벌 시험 점수 사이의 관계뿐만 아니라 개별 문항의 용이성이나 난이도를 분석하는 데 사용될 수 있다. 예를 들어, 시험에서 높은 점수를 받은 학생이 문제를 맞힌다면 그 문제는 좋은 문제로 여겨질 것이다. 마찬가지로, 만약 시험에서 낮은 점수를 받은 학생이 질문에 잘못 대답한다면, 그 질문은 좋은 질문으로 여겨질 것이다. 항목 분석을 기반으로 시험의 수정 및 개선이 이루어질 수 있다.
Item analysis of test results uses quantitative methods to help make judgements about which questions need to be adopted, which questions need to be revised and which questions should be discarded. Item analysis can be used to analyse the ease or difficulty of individual questions as well as the relationship between individual questions and the global test score. For example if a student with a high score on the test answers a question correctly that question would be considered a good question. Equally, if a student with a low score on the test answers a question incorrectly, that question would be considered a good question. On the basis of item analysis, a revision and improvement of the test can be made (Cohen & Swerdlik 2010).
문항 난이도 지수
The item-difficulty index
만약 모든 학생들이 특정한 질문에 옳거나 틀리게 대답한다면, 그 질문은 좋은 질문이 아니며 검토할 필요가 있다. 그것은 너무 쉽거나 너무 어렵다. 학생에게 너무 쉽거나 너무 어려운 문제들은 학생의 능력에 대한 정보를 거의 제공하지 않는다. 항목 난이도 지수(항목 시설이라고도 함)는 시험 문제를 맞힌 학생 수의 백분율을 말하며 다음과 같이 계산한다.
If all students answer a particular question either correctly or incorrectly, that question is not a good question and needs examining. It is either too easy or too difficult. Questions which are too easy or too hard for a student contribute little information regarding the student's ability (Green et al. 1984). The item-difficulty index (sometimes also termed item facility) refers to the percentage of the total number of students who answered the test question correctly and is calculated as follows:

여기서 R은 문제를 맞힌 총 학생 수이고 N은 총 응답 수(정답 + 오답 + 빈 응답)입니다. 그 문제 번호는 i라고 불린다. P는 정답의 분수입니다. 예를 들어 100명 중 40명이 1번 문제를 맞혔을 경우 항목 난이도 지수는 다음과 같이 간단하게 계산된다.
Where R is the total number of students who answered the question correctly and N is the total number of responses (correct + incorrect + blank response). The question number is called i. P is the fraction of correct answers. For instance, if 40 of the 100 students answered question 1 correctly, the item-difficulty index is simply calculated as follows:

따라서 항목 난이도 지수의 값은 0부터 1까지(모든 사람이 질문에 올바르게 대답하지 않은 경우)이다. 또한 P 값이 클수록 질문이 쉬워집니다. P_i가 0.3과 0.8 사이에 있으면 해당 질문이 좋은 질문으로 간주됩니다.
Consequently the value of an item-difficulty index ranges from 0 (if no one answered a question correctly) to 1 (if everyone answered a question correctly). In addition, the larger the P value, the easier the question. If Pi is located between 0.3 and 0.8, the question is considered to be a good question.
그러나 객관적 시험에서 추측의 효과를 고려할 필요가 있다. 예를 들어, 5가지 옵션 객관식 문제를 추측할 확률은 0.20입니다. 이 경우 정답을 맞힐 확률과 1.00(모두 정답일 경우)을 더한 뒤 합을 2로 나누면 (0.20 + 1.00)/2 = 0.60이다. 반대로, 정답 확률이 0.5인 진-거짓 문제에서 수정된 문제 난이도는 0.75 즉, (0.5 + 1.0)/2이다. 이 경우 '양호' 문항은 각각 0.2~0.6과 0.5~0.75 사이의 항목 난이도를 가져야 한다.
However, the effects of guessing in objective tests needs to be considered. For example, the probability of guessing a five-option multiple choice questions is equal to 0.20. In order to calculate the corrected question difficulty in this case, we need to add the probability of getting an answer right and 1.00 (if everyone answered a question correctly) and then divide the sum by 2, that is, (0.20 + 1.00)/2 = 0.60. Conversely, the corrected question difficulty in a true-false question, where the probability of a correct answer is 0.5, is equal to 0.75, i.e. (0.5 + 1.0)/2. In these cases ‘good’ questions should have a range of item difficulty between 0.2–0.6 and 0.5–0.75, respectively.
데이비스는 '기회성공'을 위해 문제가 수정되어야 할 때 항목 난이도를 결정하기 위한 다음과 같은 일반 공식을 제시하였다(Davis 1952).
Davis has presented the following general formula for determining item difficulty when questions need to be corrected for ‘chance success’, (Davis 1952):

여기서 PDi는 문제 번호(i)에 대해 수정된 항목 난이도 지수, R은 문제 정답자 수, W는 문제 정답자 수, n은 문제 선택 수, K는 학생 수, KR은 미답자 수이다.그가 질문한다.
Where PDi equals the item-difficulty index corrected for the question number (i), R equals the number of students who answer a question correctly, W equals the number of students who answer a question incorrectly, n equals the numbers of choices in a question, K equals the number of students, and KR equals the number of students who do not answer the question.
문항-변별 지수
The item-discrimination index
문항 변별지수는 성적이 좋은 학생과 그렇지 않은 학생, 또는 '강한' 학생과 '약한' 학생을 얼마나 잘 구별할 수 있는지를 나타내는 값이다. 문항 변별 지수는 소문자 기울임꼴 "d"로 표시됩니다. d의 범위는 -1.00 ~ 1.00입니다. 이제 개별 질문에 대한 d-값을 계산하는 가장 일반적인 방법이 설명된다.
The item-discrimination index is a value of how well a question is able to differentiate between students who are high performing and those who are not, or between ‘strong’ and ‘weak’ students. The item-discrimination index is symbolised by a lowercase italic “d”. The range of d is −1.00 to 1.00. The most common method to calculate a d-value for individual questions is now described.
이 방법에서 시험관은 각 학생의 점수표에 따라 학생들을 두 그룹('높음'과 '낮음')으로 나눕니다. 이 분류를 기준으로 학생의 27%가 강자 집단, 27%가 약자 집단으로 분류된다. 일부 방법은 '상위 3분의 1'과 '하위 3분의 1'을 선호하지만, 27%를 기준으로 학생들을 두 그룹으로 나누면 d값의 민감도와 정밀도가 높아진다는 연구결과가 나왔다. 분명히 중위권 학생의 46%는 항목별 차별 지수 계산에서 제외된다.
In this method, the examiner divides students into two groups (‘high’ and ‘low’) according to the score sheet of each student. On the basis of this classification, 27% of the students are categorised as a strong group and 27% as a weak group. Some methods prefer a ‘top third’ and a ‘bottom third’ but studies have shown that when students are divided into two groups on the basis of 27% the sensitivity and precision of the value of d is increased (Kelley 1939; Cohen & Swerdlik 2010). Obviously 46% percent of the middle-scoring students are excluded from the calculation of the item-discrimination index.
다음으로, (두 그룹의) 특정 질문에 정확하게 답하는 학생의 수가 계산됩니다. 다음 공식은 d-값을 계산하는 데 사용됩니다.
Next the number of students (in both groups) who answer a particular question correctly is calculated. The following formula is used to calculate a d-value.

여기서 U는 상위 그룹의 정답 수와 같으며, L은 하위 그룹의 정답 수와 같으며, n은 전체 학생 수의 27%입니다. 예를 들어, 한 생리학 강사가 총 112명의 의대생들에게 신경생리학 테스트를 실시했습니다. 강사는 시험 점수의 상위와 하위 27%를 분리했는데, 각 그룹별로 총 28명의 학생이 있었다. 강사는 '강한'(상위) 그룹 18명이 1번 문제를 맞혔고, '약한'(하위) 그룹 10명이 1번 문제를 맞혔다고 관찰한다. 따라서 d-값은 0.28 = [(18–10)/28]과 같습니다. d 값이 높을수록 시험 문제가 더 좋고 변별력이 더 높다.
Where U equals the number of correct answers in the upper group, L equals the number of correct answers by the lower group and n is 27% of the total number of students (Cohen & Swerdlik 2010). For example, a physiology lecturer gave the neurophysiology test to a total of 112 medical students. The lecturer isolated the top and bottom 27% of the test scores, with a total of 28 students in each group. The lecturer observes that 18 students in the ‘strong’ (top) group answered question 1 correctly and 10 students in the ‘weak’ (bottom) group answered correctly question 1. Therefore, the d-value is equal to 0.28 = [(18–10)/28]. The higher the d value, the better and more discriminating the test question.
주어진 문항이 d-값이 높으면 매우 변별력이 있을 가능성이 높다. 그러나 주어진 문항의 d-값이 음수일 경우 '강한' 학생은 오답을, '약한' 학생은 정답을 맞힌다는 것을 의미한다. 그러한 질문들은 수정되거나 폐기되어야 한다.
If a given question has a high d-value, it is likely to be very discriminating. However, a negative d-value on a given question indicates that the ‘strong’ students answered the question incorrectly and the ‘weak’ students answered the question correctly. Such questions should either be revised or discarded.
점 이직렬 상관 계수
The point bi-serial correlation coefficient
항목-차별 지수를 계산하는 데 널리 사용되는 또 다른 방법은 포인트 바이-시리얼 상관 계수이다. 이 통계량은 시험의 특정 문제(정답 또는 오답)와 총 시험 점수(Kapplan 2008) 사이의 관계를 나타내는 통계량입니다. 문제는 '맞음'에 1점, '틀림'에 0점입니다. 시험 문제의 정답 합계는 총 학생의 점수를 산출한다. 각 질문에 대한 항목 식별 지수를 계산하기 위해 다음 공식이 사용됩니다.
Another widely used method for computing the item-discrimination index is the point bi-serial correlation coefficient. This is a statistic that indicates the relationship between a particular question (correct or incorrect) on a test and the total tests score (Kaplan 2008). Questions are scored 1 for ‘correct’ and 0 for ‘wrong’. The sum of correct answers of test questions produces the total student's score. To calculate the item-discrimination index for each question the following formula is used:

여기서 Rpbi는 점 이중 직렬 상관 계수와 같다.
Where Rpbi equals the point bi-serial correlation coefficient,

항목을 올바르게 답한 학생의 평균 점수(1s로 코딩된 학생)와 같다.
equals the mean score of students answering the item correctly (those coded as 1s),

이 값은 학생이 항목을 잘못 대답한 평균 점수(0s로 코드화된 점수)와 같으며 St는 전체 시험의 표준 편차와 같습니다. P는 항목을 올바르게 답하는 학생의 비율입니다. Rpbi 값이 높을수록 질문이 더 잘 변별합니다. Rpbi 값의 범위는 -1.0 ~ +1.0입니다. 부정적인 Rpbi가 포함된 질문은 수정하거나 폐기해야 합니다.
equals the mean score of students answering the item incorrectly (those coded as 0s), and St equals the standard deviation for the entire test. P equals the proportion of students answering the item correctly. The higher the Rpbi value, the better the question is at discriminating. The Rpbi values range from −1.0 to +1.0. A question with a negative Rpbi should be revised or discarded.
통계적 유의성
Statistical significance
객관식 문제의 자질을 평가하는 마지막 방법은 'R조'라고 불리는 항목과 'W조'라고 불리는 항목에서 정답이 나온 학생을 두 그룹으로 나누는 것이다. 'R조'와 'W조'의 총점 평균이 계산된다. 그룹의 평균 점수
The last method for the assessment of the quality of a multiple-choice question is to divide students into two groups, those who answered the item correctly, called ‘group R’, and those who answered the item incorrectly, called ‘group W’. The mean of the total score of ‘group R’ and ‘group W’ is calculated. The mean score of group

그룹의 평균 점수보다 낮거나 높을 수 있음
could be below or above the mean score of group

. 따라서 고려해야 할 귀무 가설은 다음과 같다.
. Consequently, the null hypothesis that should be considered is that ‘

와 같다
is equal to

', '라는 대립 가설에 반하여 저울질했다.
’, weighed against the alternative hypothesis that ‘

보다 크다
is greater than

'. 귀무 가설은 정답을 선택한 학생들의 평균 점수와 오답 사이에 차이가 없다는 것을 의미한다. 귀무 가설을 검정하기 위해 t-검정을 사용하여 두 그룹의 평균 여부를 평가할 수 있습니다.
’. The null hypothesis means that there is no difference between the mean scores of the students who chose the correct answer and the wrong answer. To test the null hypothesis a t-test can be used that assesses whether the means of two groups (

그리고.
and

)은 통계적으로 서로 다르다. p-값이 0.05보다 작으면 귀무 가설을 기각하고 대립 가설을 받아들입니다. 이것은 시험 문제가 학생들을 두 개의 강/약 그룹으로 나누었다는 것을 의미한다.
) are statistically different from each other. If the p-value is less than 0.05, we will reject the null hypothesis and accept the alternative hypothesis. This means that the test question has divided students into two separate strong/weak groups.
신뢰성.
Reliability
신뢰도를 계산하는 주요 방법들이 설명되고 설명될 것이다. 점-이진 상관 계수와 크론바흐의 알파를 사용한 예는 테스트의 신뢰성이 어떻게 향상될 수 있는지를 설명하는 데 사용될 것이다. OSCE 검사에서 평가자 간 및 평가자 내 신뢰성의 평가가 설명될 것이다.
The main methods of calculating reliability will be described and explained. Examples of the use of point-biserial correlation co-efficient and Cronbach's Alpha will be used to explain how the reliability of tests can be improved. The evaluation of inter and intra-rater reliability in OSCE examinations will be described.
[신뢰성]을 설명하고 정의하는 전통적인 방법은 [평가의 재현성, 안정성 및 내부 일관성]과 관련이 있다. 심리측정학 문헌에서 신뢰성은 일반적으로 측정 도구의 일관성을 의미한다.
- 예를 들어, 학생이 같은 시험을 반복적으로 치르고 같은 점수를 받는다면 시험은 안정적이다.
- 신뢰성은 다른 경우에 적용될 때 유사한 결과를 생성하는 테스트의 능력을 측정하는 척도입니다.
- 같은 시험에서 다른 경우에 얻은 점수 차이가 클 때, 시험은 신뢰할 수 없고 치명적인 결함이 있다. 예를 들어, 동일한 성취도 테스트가 한 학생에 대해 서로 다른 시점에 62, 85, 53 및 92와 같은 점수를 낸다면, 이 테스트는 일관성이 없기 때문에 조사가 필요합니다.
- 검정의 내부 일관성은 동일한 기본 구조를 측정하기 위해 개별 항목이 함께 얼마나 잘 기능하는지와 관심 구조를 얼마나 정확하고 정확하게 측정할 수 있는지를 측정하는 척도이다.
The traditional way of explaining and defining reliability is that it is concerned with the reproducibility, stability and internal consistency of an assessment. In the psychometric literature, reliability more generally refers to the consistency of a measurement tool (Cohen & Swerdlik 2010).
- For example a test is stable if a student repeatedly takes the same test and obtains the same mark.
- Reliability is a measure of a test's ability to generate similar results when applied on different occasions. When the difference of scores obtained by the same test on different occasions is high, the test cannot be reliable and is fatally flawed.
- For example, if the same achievement test delivers scores for a student of 62, 85, 53 and 92 in different points in time, then this test is not consistent and needs to be investigated.
- The internal consistency of a test is a measure of how well the individual items are functioning together to measure the same underlying constructs and how accurately and precisely can it measure the construct of interest.
[신뢰도]에 대한 또 다른 사고방식은 학생의 [관찰된 시험 점수]와 ['참' 점수]의 차이의 함수라는 것이다. 관찰된 점수는 학생이 실제 시험에서 얻은 점수입니다. 진정한 점수는 학생이 자신의 기본 능력을 정확하게 측정할 때 (가정적인) 시험에서 얻는 점수이다. [관측된 시험 점수]와 [실제 점수] 사이에 유의한 차이가 있으면 시험의 신뢰성이 낮으며, 그 반대도 마찬가지이다.
Another way of thinking about test reliability is that it is a function of the difference between the observed test score of the student and his/her ‘true’ score. The observed score is the score that a student obtains from an actual test. The true score is the score that a student obtains from a (hypothetical) test when it accurately measures his or her underlying ability. If there is a significant difference between an observed test score and a true score, the reliability of the test is low, and vice versa.
그러나 신뢰성에 대한 보다 일반적인 견해는 [심리측정학적 측정에 내재된 오류]와 관련이 있다는 것이다. 평가 언어에서 측정 오류를 일으키는 요인은 크게 두 가지, 외부 및 내부 요인입니다.
- [외적 요인]은 시험 상황과 시험 상황에 따라 달라지는데, 예를 들면 실내 온도, 추측 정답, 정서적 문제, 신체적 불편함, 수면 부족 등이다.
- [내부 요인]은 항목 샘플링(시험 항목 수 제한) 및 항목 구성 방식 등 시험의 품질과 양에 따라 달라집니다. 채점자와 채점 시스템도 잠재적인 오류의 원인이 될 수 있다.
However, a more general view of reliability is that it is concerned with the error inherent in psychometric measurements. In the language of assessment, there are two main factors that cause errors in measurements, external and internal factors (Anastasi & Urbin 1997).
- The external factors depend on the test situations and administrations, such as the room temperature, guessing answers, emotional problems, physical discomfort and lack of sleep.
- The internal factors depend on the quality and quantity of the test, such as item sampling (the limited number of test items) and the way in which the item is constructed. Scorers and scoring systems can also be a potential source of error.
고전적인 시험 이론은 개인이 특정한 양의 지식, 예를 들어 '진정한 점수'에 대한 기호 T를 가지고 있다고 제안한다. 그러나 이 점수의 측정값 또는 '관찰된 점수'인 X는 측정 오류 E로 인해 교란됩니다. 따라서,
Classical test theory proposes that an individual possesses a particular amount of, for example, knowledge, given the symbol T for ‘true score’. However the measurement of this score, X, or the ‘observed score’ is confounded by the errors of measurement, E. Thus,

고품질 평가 설계자가 직면한 과제는 이러한 오류의 원인을 식별하고 최소화하는 것이어야 한다. 크기나 온도에 대한 물리적 측정은 상대적으로 제한적이고 쉽게 통제되는 측정 오류를 가질 수 있는 반면, 인지적, 정신운동적 또는 인간에 대한 정서적 측정은 통제 불가능한 큰 오류를 가질 수 있다. 신뢰성에 영향을 미치는 세 가지 오류 원인은 [테스트, 수험생(학생) 및 테스터]에서 비롯됩니다. 많은 경우 평가를 수행하기 전에 오류를 식별하고 제어할 수 있지만 모든 가능한 오류를 추정하는 것은 현실적으로 불가능하다. 결과적으로, 시험의 진정한 신뢰성 계수true reliability coefficient 를 결정하는 것은 실용적이지 않다. 따라서, 의학 교사는 아래에 설명될 신뢰성 추정 기법을 사용하여 시험을 실시한 후 획득한 데이터로부터 시험의 신뢰성을 추정해야 한다.
The task facing the designer of high quality assessments should be to identify and minimise these sources of error. Physical measurements of size or temperature may have relatively limited and easily controlled errors of measurement whereas cognitive, psychomotor or affective measurements on human beings may have large, uncontrollable and even unknown errors. The three sources of error influencing reliability derive from: the test, the testee (student) and the tester. In many cases errors can be identified and controlled before an assessment is undertaken but it is practically impossible to estimate every possible error. As a result, the determination of the true reliability coefficient of a test is not practicable. Therefore, medical teachers have to estimate the reliability of a test from the data acquired after the test has been administered using the techniques for estimating reliability to be described below.
테스트
The test
테스트는 서면 지식 기반 MCQ, OSCE 스테이션 또는 다른 형태의 심리 측정 평가일 수 있다. [생산 및 해석 과정]과 [테스트 환경]에 영향을 미치는 프로세스에서 오류가 발생합니다.
The Test can be a written knowledge-based MCQ, an OSCE station or some other form of psychometric assessment. Errors are created in its production and interpretation and by processes impacting on the testing environment:
- 애매한 질문
- 너무 길다(피로)/너무 짧다
- 잘못된 질문
- 비균질 질문지
- 너무 어렵다/너무 쉽다
- 서투른 지시
- 너무 덥다/너무 춥다/너무 시끄럽다
- 시간이 충분하지 않아요.
- 조명 수준
- 잘못된 코드화된 응답
- Ambiguous questions
- Too long (fatigue)/Too short
- Invalid questions
- Non-homogeneous question paper
- Too hard/too easy
- Poor instructions
- Too hot/too cold/too noisy
- Not enough time
- The level of lighting
- Responses which are coded incorrectly
테스터
The tester
검사자는 MCQ와 같은 필기 시험을 작성할 책임이 있는 사람 또는 OSCE 또는 기타 실제 평가의 경우 평가 기준을 사용하고 해석할 책임이 있는 사람일 수 있다. 오류는 평가 원칙 또는 항목 구성에 대한 이해 부족 또는 평가 기준 적용에 대한 교육 부족으로 인해 발생할 수 있습니다.
The tester can be the person responsible for creating a written test such as an MCQ or, in the case of an OSCE, or other practical assessment, the person who is responsible for using and interpreting the assessment criteria. Errors can be created from a lack of understanding of assessment principles or item construction or by a lack of training in applying assessment criteria:
- 학습 목표에 대한 이해 부족
- 평가 기준에 대한 잘못된 해석
- 평가 기준의 일관성 없는 적용
- 점수 체계 또는 점수 체계 불일치
- 성차별적/인종차별적 편견
- 체계적인 타이핑 오류
- 평가 교육 부족
- 평가자간 변동성
- 채점 주관성
- Lack of understanding of learning objectives
- Poor interpretation of assessment criteria
- Inconsistent application of assessment criteria
- Inconsistent scoring system or mark scheme
- Sexist/racist bias
- Systematic typing errors
- Lack of assessment training
- Inter-rater variability
- Subjectivity in scoring
수험생
The testee
수험자는 시험 대상자이다. 개인의 본질적인 능력 때문이 아닌 오류와 변화는 스트레스나 질병에 대한 반응이나 적절한 교육 또는 학습 준비 부족으로 인해 발생할 수 있다.
The testee is the person being tested. Error and variation not due to the intrinsic capacity of the individual can be caused by their reaction to stress or illness or by a lack of appropriate teaching or learning preparation:
- 스트레스
- 치료 및 질병
- 수업부족
- 일관성 없는 교육
- 열악한 학습 환경
- 적절한 자원 부족
- 연습 기회 부족
- 수면부족
- Stress
- Therapy and illness
- Lack of teaching
- Inconsistent teaching
- Poor learning environment
- Lack of appropriate resources
- Lack of practice opportunities
- Lack of sleep
신뢰성 추정치
Reliabilities estimates
테스트-재테스트 신뢰성 추정치
Test–retest reliability estimates
테스트-재테스트 신뢰성은 동일한 학생과 다른 시간에 동일한 테스트를 수행함으로써 추정됩니다. 두 시험에서 학생들의 점수 사이의 상관계수(ra)는 시험-재시험 신뢰성의 정량적 척도로 사용된다.
The test-retest reliability is estimated by performing the same test at different times with the same students. The correlation coefficient (ra) between students’ scores in the two tests is used as a quantitative measure of the test–retest reliability.
시험-재시험 신뢰성의 한계는 시간의 경과가 두 번째 시험에서 학생의 반응에 영향을 미칠 수 있다는 것이다. 왜냐하면 학생들은 새로운 것을 배우고, 어떤 것을 잊거나, 새로운 기술을 습득할 수 있기 때문이다.
A limitation of the test–retest reliability is that the passage of time can influence the student's response in the second test. This is because students may learn new things, forget some things or acquire new skills.
병렬 형식 신뢰성 추정치
Parallel-forms reliability estimates
[병렬 형식]의 시험을 사용하면 시험-재시험 신뢰성에 관련된 어려움을 피할 수 있다. 신뢰도를 추정하기 위해 검정의 두 표본이 두 가지 다른 경우에 검정됩니다. 첫 번째 경우, 학생들은 한 가지 형태의 시험으로 시험을 치른다. 두 번째 경우, 같은 학생들이 평행한 형태의 시험으로 시험을 치른다. 병렬 시험 양식은 평균 항목 난이도가 같아야 한다. 또한, 평행한 형태로 관찰된 시험 점수의 평균과 표준 편차는 동일해야 한다. 병렬 형식 신뢰도를 추정하는 것은 테스트-재테스트 신뢰도를 추정하는 것과 유사합니다. 두 시험 병렬 양식에서 학생들의 점수는 병렬 양식 신뢰도의 추정치를 얻기 위해 상관관계가 있다.
The use of parallel forms of the test helps avoid the difficulties involved in test–retest reliability. To estimate the reliability, two different samples of a test are tested on two different occasions. In the first occasion, students are tested with one form of the test. On the second occasion, the same students are tested with a parallel form of the test. Parallel test forms should have the same average item difficulty. In addition, the mean and the standard deviations of observed test scores in parallel forms should be equal. Estimating parallel forms reliability is similar to estimating test–retest reliability. Students’ scores on the two test parallel forms are correlated to obtain an estimate of parallel-forms reliability.
병렬 형식 신뢰도 추정치의 한 가지 분명한 한계는 시험 점수가 피로, 동기부여 및 학습과 같은 요인에 의해 영향을 받을 수 있다는 것이다.
One obvious limitation of estimates of parallel-forms reliability is that test scores may be affected by factors such as fatigue, motivation and learning.
양분 신뢰도 추정치
Split-half reliability estimates
전체 테스트의 신뢰성을 추정하기 위해, 단일 테스트를 수행한 후 항목을 반으로 분할할 수 있습니다. 홀수 번호는 시험의 절반에 해당하고 짝수 번호는 나머지 절반에 해당된다. 스피어맨-브라운 상관 관계를 사용하여 신뢰성 계수에 대한 검정 단축 효과를 추정할 수도 있습니다. 테스트의 크기를 적절하게 줄이면 관리 시간과 학생들의 시험 피로를 최소화할 수 있습니다(Cohen & Swerdlik 2010).
To estimate the reliability of a whole test, a single test can be administrated followed by a splitting of the items into halves; odd-numbered items to one half of the test and even-numbered to the other half. A Spearman–Brown correlation can also be used to estimate the effect of shortening the test on the reliability coefficient. Reducing the size of a test appropriately can minimise administration time and students’ exam fatigue (Cohen & Swerdlik 2010).
알파 계수
Coefficient alpha
알파 값은 시험의 내부 일관성 신뢰성 또는 항목 동질성을 추정하는 데 널리 사용된다(Henson 2001; Streiner 2003). 앞에서 설명한 신뢰도 지수와는 달리 테스트는 한 번만 수행되며 알파 통계량을 계산하는 데 사용되는 점수입니다. 알파는 시험 항목 집합의 상호 연관성에 대한 추정치로 간주할 수 있다(Schmitt 1996). 알파 값은 또한 검사 항목이 얼마나 유사하거나 고유한지를 나타냅니다(Cortina 1993). 알파 계수는 이분법 또는 다분법 항목을 사용한 검정에서 사용할 수 있습니다. 값은 0에서 1까지이며 0.70보다 커야 하지만 0.90보다 크면 안 됩니다. 획득한 점수는 모든 시험 항목의 반영이기 때문에, 시험관들은 시험에서 높은 알파 값을 찾는다. 그러나 알파 값이 높은 것이 보통 더 좋지만 항상 그런 것은 아닙니다. 단일 도메인을 측정하는 검정에는 항목 간의 이질성이 어느 정도 포함될 수 있습니다. 테스트가 단일 도메인을 사용하지만, 하위 도메인이 3개 또는 4개인 경우, 각 하위 도메인의 동질성은 테스트 전체보다 더 클 수 있습니다. 이 경우 알파 값이 0.90을 초과하면 안 됩니다. 이 상황에서 알파의 큰 값은 '항목 간 콘텐츠의 불필요한 중복'을 나타내며 동질성보다는 중복성에 더 중점을 둔다(Streiner 2003).
The value of alpha is widely used for estimating the internal consistency reliability or item homogeneity of a test (Henson 2001; Streiner 2003). In contrast to previously described reliability indices the test is only administered once and the scores used to calculate the alpha statistic. Alpha can be considered as an estimate of the interrelatedness of a set of test's items (Schmitt 1996). The value of alpha also indicates how similar or unique test items are (Cortina 1993). The alpha coefficient can be used on either tests with dichotomous or polytomous items. It ranges in value from 0 to 1 and should be above 0.70, but not much than 0.90 (Nunnally & Bernstein 1993; Streiner 2003). As the obtained score is a reflection of all the test's items, examiners seek for a high value of alpha on a test. However, although a high value for alpha is usually better, it is not always the case. Tests that measure a single domain can contain some degree of heterogeneity among the items. If a test taps a single domain but has three or four sub-domains, the homogeneity of each sub-domain can more than the test as a whole. If this is the case, the value of alpha should not be over 0.90. In this situation a large value of alpha is an indication of ‘unnecessary duplication of content across items and points more to redundancy than to homogeneity’ (Streiner 2003).
Kuder-Richardson 신뢰성
Kuder–Richardson reliability
이전에 지적했듯이, 더 높은 테스트 동질성은 테스트 내에서 더 높은 내부 일관성을 생성합니다. 성취도 시험에서 내부 일관성 신뢰성을 추정하기 위한 가장 일반적인 통계적 절차는 쿠더-리처드슨 20(KR-20)이다. 알파 계수와 달리 KR-20은 객관적인 테스트와 같은 정답 혹은 오답으로 채점되는 [이분법 문항]의 내부 일관성을 결정하는 데 사용된다. KR-20의 값은 시험 항목 간 관계의 강도에 정비례한다. 이 값은 0에서 1 사이의 범위이며, 0은 신뢰성의 부족을 나타내고 1은 신뢰성이 높은 검정을 나타냅니다.
As previously pointed out higher test homogeneity generates a higher internal consistency within a test. The most common statistical procedure for estimating the internal consistency reliability in achievement tests is Kuder–Richardson 20 (KR-20). In contrast to coefficient alpha, KR-20 is used to determine the internal consistency of dichotomous items such as objective tests which can be scored as either right or wrong. The value of KR-20 is directly proportional to the strength of the relationship between the items on the test. It ranges between 0 to 1 where 0 represents a lack of reliability and 1 represents a fully reliable test.
항목 동질성이 시험 신뢰성에 미치는 영향을 요약하면, 내부 일관성 신뢰성에 대한 두 가지 다른 지수를 사용할 수 있다.
알파 계수 및 KR-20. 신뢰도 값이 낮을수록 시험의 모든 항목이 다양한 지식이나 성능을 측정한다는 점에 유의해야 한다. 또한 신뢰도 지수는 시험과 학생들의 이질성에 영향을 받는다. 장기간의 시험과 이질적인 학생들은 더 높은 내부 일관성 신뢰성을 갖게 될 것이다(Anastasi & Urbin 1997).
In summary to estimate the impact of item homogeneity on test reliability, two different indices of internal consistency reliability are available: coefficient alpha and KR-20. It should be noted that a lower reliability value indicates that all the items on the test measure a diversity of knowledge or performance. Furthermore, the reliability index is affected by the test and students’ heterogeneity. Longer tests and heterogeneous students will have a higher internal consistency reliability (Anastasi & Urbin 1997).
OSCE의 심리학적 특성
Psychometric properties of OSCE
OSCE 스테이션의 심리측정학적 분석은 지식 기반 시험에 비해 의학 교육 문헌에 덜 보고되었다. 시험 목적에 따라 시험장 수가 달라질 수 있으며 각 시험장마다 응시자의 특정 능력을 평가할 수 있다. 특정 행동을 정량화하기 위해, 특정 행동에 해당하는 체크리스트 항목은 컨센서스를 통해 콘텐츠 전문가가 객관적으로 고안한다. 시험관은 특정한 행동이 이분법적으로 또는 척도로 능숙하게 수행되었는지 여부를 확인하여 각 스테이션의 학생을 채점한다. 각 스테이션의 마지막에, 시험관들은 그들의 점수와 학생들의 성적에 대한 피드백을 기록합니다. 각 스테이션에 있는 item의 개수는 다를 수 있습니다. 예를 들어, 점검표에 21개의 항목이 있는 스테이션 1에서 학생은 15개의 임상 조치를 유능하게 수행할 수 있다. 따라서, 그 또는 그녀는 역 1에서 21점 만점에 15점의 총점을 받는다. OSCE가 25개의 스테이션로 구성되어 있고 학생 성취도를 측정하기 위해 등급 척도를 사용하는 경우 25개의 등급이 계산되고 각 학생에 대한 평균이 계산된다. OSCE 이전에, 각 스테이션에 대한 전체 통과 마크는 표준 설정에 의해 결정된다. 다른 평가 절차에는 점수와는 무관하게 주어진 합격, 불합격 또는 경계선에 대한 심사관의 글로벌 판단이 포함될 수 있다.
The psychometric analysis of OSCE stations has been less reported in the medical education literature in comparison to knowledge based tests. Depending on the purpose of the examination, the number of stations can vary and each station can assess a specific ability of the candidate. To quantify a specific behaviour, checklist items, which correspond to specific actions, are objectively devised by content experts through consensus. The examiner marks the student in each station by checking whether or not a given action was performed competently either dichotomously or on a scale. At the end of each station, examiners record their scores and feedback on the performance of students. The number of items in each station can vary. As an example, in station 1 with 21 items on the checklist, a student might competently perform 15 clinical actions. Therefore, he or she receives a total score of 15 out of 21 from station 1. If the OSCE consists of 25 stations and uses a rating scale for measuring student performance 25 ratings are calculated and then the mean for each student. Before the OSCE, the overall pass mark for each station is decided by standard setting. Other assessment procedures might include a global judgement by the examiners of pass, fail or borderline given independently of any scoring.
OSCE의 스테이션 분석
Station analysis of OSCEs
OSCE에서 각 스테이션은 분석 항목으로 간주된다. 첫 번째 공통 분석은 OSCE의 [모든 스테이션 간의 상관 관계]를 나타내는 OSCE의 [스테이션 간 신뢰도]를 결정하는 것이다. 스테이션 간 신뢰도 지수를 계산하는 것은 동질성을 평가하는 데 유용하다. OSCE는 단일 특성을 측정하는 관측소를 포함하는 경우 동질적이다.
In the OSCE, each station is regarded as an item of analysis. The first common analysis is to determine the inter-station reliability of the OSCE which refers to the degree of correlation between all the stations on the OSCE. Calculating the index of inter-station reliability is useful in assessing homogeneity. OSCEs are homogeneous if they contain stations that measure a single trait.
쿠더-리처드슨 20 공식(KR-20)은 의학 교사들이 스테이션 간 신뢰성을 추정할 수 있도록 한다. KR-20 공식은 다음과 같다.
The Kuder-Richardson 20 formula (KR-20) allows medical teachers to estimate inter-station reliability. The KR-20 formula is

여기서 rKR20은 전체 OSCE의 신뢰성 계수를 제공하며, K는 OSCE의 스테이션 수, λ2는 총 스테이션 점수의 분산, p는 스테이션을 통과한 학생의 비율, q는 스테이션을 통과하지 못한 학생의 비율(q = 1 - p), Zpq는 모든 스테이션의 pq 곱의 합계이다. K-R20은 SPSS를 사용하여 계산됩니다. 신뢰도 계수가 높을수록 OSCE는 균일하다.
Where rKR20 provides a reliability coefficient of the whole OSCE, K is the number of stations in the OSCE, σ2 is the variance of total station scores, p is the proportion of students who pass the station, q is the proportion of students who fail the station (q = 1 − p), and Zpq is the sum of the pq products over all stations. K-R20 is calculated using SPSS. The higher the reliability coefficient, the more homogenous the OSCE.
신뢰도 계수가 낮다는 것은 OSCE 검사에 기여하는 임상역량 평가에서 많은 스테이션의 성능이 좋지 않다는 것을 보여준다.
A low reliability coefficient shows that a number of stations are performing poorly in assessing the clinical competencies contributing to the OSCE examination.
신뢰성 계수가 낮으면 일부 관측소가 공통 핵심 임상 성과를 동등하게 공유하지 않으므로 수정하거나 폐기해야 한다. 따라서 각 스테이션과 총 OSCE 점수의 상관관계를 계산하여 검출하는 것이 중요하다. 여기에는 앞서 설명한 바와 같이 점-이중 선형 상관 방법을 사용하는 것이 포함됩니다. 항목(스테이션) 총상관성 검사를 통해 의료교사는 어떤 스테이션을 수정하거나 폐기해야 하는지 파악할 수 있다.
If the reliability coefficient is low it suggests that some stations do not share equally in the common core clinical performance and need to be revised or discarded. Therefore it is important to detect them by computing the correlation of each station with the total OSCE score. This involves using the point-biserial correlation method as previously described. The item (station) total correlation test allows medical teachers to identify which station needs to be revised or discarded.
OSCE 시험의 동질성을 증가시킬 수 있는 또 다른 분석은 평균 측점 점수와 평균 총 OSCE 점수 사이의 상관관계를 찾는 데 사용할 수 있는 피어슨 상관관계를 사용하는 것이다. 각 스테이션이 OSCE 동질성에 기여하고 있으므로 전체적으로 OSCE 시험과 상관관계가 없는 스테이션은 수정하거나 폐기할 수 있다. 시험이나 OSCE 시험의 동질성과 이질성은 다음 절에서 추가로 논의되는 중요한 문제이다.
Another analysis that can increase the homogeneity of an OSCE exam is the use of Pearson's correlation which can be used to find a correlation between mean station scores and the mean total OSCE score. As each station is contributing to OSCE homogeneity, those stations that do not correlate with the OSCE exam as a whole can be revised or discarded. The homogeneity and heterogeneity of a test or an OSCE exam is an important issue that is further discussed in the next section.
품목의 동질성과 이질성
Homogeneity and heterogeneity of the items
시험의 문항들이 단일 특징을 측정하는 경우 시험을 균질하다고 합니다. 즉, 동질성은 테스트가 단일 영역을 두드리는 정도이며 다른 능력을 측정하는 항목은 포함하지 않습니다. 예를 들어, 심혈관 생리학 시험은 모든 의학 생리학이 아니라 심혈관 시스템에 대한 지식을 평가해야 한다. 테스트의 항목은 항목 풀의 랜덤 샘플에서 가져와 단일 도메인을 측정해야 합니다. 이 항목들은 또한 서로 조금 다른 정도로 서로 상관되어야 한다(Streiner 2003).
If the items of a test measure a single feature, the test is termed homogenous. In other words, homogeneity is the extent to which a test taps a single domain and does not include items that measure other abilities. For example, a test of cardiovascular physiology should assess knowledge of the cardiovascular system, not all medical physiology. It should be noted that items on a test should come from a random sample of the item pool and measure a single domain. These items should also correlate with each other to varying degrees (Streiner 2003).
테스트 동질성과는 대조적으로, 이질적 테스트의 항목은 서로 다른 도메인이나 속성을 사용합니다. 위의 예에서 심혈관 시스템의 항목은 한 영역을 두드리는 반면 의학 생리학 항목은 심혈관 시스템을 측정할 뿐만 아니라 신장, 폐, 위장 시스템 등을 측정한다.
- [동질적 객관식 시험]에서 같은 점수를 받은 사람들은 시험한 영역에 대해 비슷한 지식을 가지고 있다.
- [이질적 객관식 시험]에서 같은 점수를 받은 사람은 시험 영역에 대한 지식이 다를 수 있다.
In contrast to test homogeneity, the items of a heterogeneous test tap different domains or attributes. In the above example the items on the cardiovascular system tap one area while the items on medical physiology not only measure the cardiovascular system but also measure renal, lung, gastrointestinal systems and so forth.
- Those who receive the same score on a multiple-choice homogenous test have a similar knowledge in the area tested.
- On the other hand, those who receive the same score on a multiple-choice heterogeneous test may have different knowledge in the areas tested (Cohen & Swerdlik 2010).
이것은 이질적인 시험에서 나온 시험 점수가 동질적인 시험보다 더 모호하다는 것을 보여준다. 이질적인 의학 생리학 테스트에서 존과 사라가 모두 30점을 받는다고 상상해 보세요. 시험에서 두 사람의 지식이나 성적이 동등했다고 단정할 수는 없다. 30점은 다양한 조합을 통해 얻을 수 있다. 존은 10개의 심혈관 생리학 항목, 10개의 감각 생리학 항목, 10개의 호흡기 생리학 항목, 그리고 신경 생리학이나 위장학 항목에는 정답이 없을 수 있다. 반면 사라는 감각생리학 항목 5개, 호흡생리학 항목 10개, 신경생리학 항목 15개를 맞혔을 수 있으며 심혈관 생리학에 대해서는 정답이 없다. 보다 구체적인 평가 데이터가 필요한 경우 각 테스트가 단일 영역을 측정하는 여러 동종 테스트를 개발하는 것이 좋습니다.
This simply illustrates that test scores that come from a heterogeneous test are more ambiguous than a homogenous test. Imagine that in a heterogeneous medical physiology test, John and Sarah both receive a score of 30. One cannot conclude that knowledge or performance of both on the test was equal. The score of 30 can be obtained through a variety of combinations. John may have correctly answered 10 cardiovascular physiology items, 10 sensory physiology items, 10 respiratory physiology items and none on neurophysiology or gastroenterology. Sarah by contrast, may have correctly answered 5 sensory physiology items, 10 respiratory physiology items and 15 neurophysiology items and none on cardiovascular physiology. If more specific assessment data is required it is better to develop several homogenous tests in which each test measures a single domain.
[시험의 동질성]은 시험의 모든 문제가 [동일한 구성 요소] 또는 특성을 측정하도록 보장하므로 [구성 타당성]의 지표이기도 하다. 시험 설계자가 측정하려는 특정 특성을 정확하게 반영하는 시험 정도를 평가하기 위해 시험 설계자는 시험 전에 시험 또는 OSCE 시험의 타당성을 결정해야 한다.
The homogeneity of a test is also an indicator of construct validity as it ensures that all the questions on the test measure the same construct or trait. It should be noted that test designers should determine the validity of a test or an OSCE exam before an examination in order to assess the degree to which the test accurately reflects the specific trait that the test designer is attempting to measure.
표준 측정 오차(SEM)
The standard Error of measurement (SEM)
검사 후 분석과 관련된 마지막 유용한 개념은 표준 측정 오차(SEM)이다. SEM은 개인의 시험 점수에 내재된 오류의 양에 대한 추정치를 제공한다. 이 추정은 평가자가 개인의 시험에서 관찰된 점수와 실제 점수 사이의 불일치를 결정하는 데 도움이 된다. 시험 신뢰성 추정치와 SEM 사이에는 연관성이 있다. 시험 [신뢰도 추정치]가 클수록 SEM은 낮아집니다. 시험의 신뢰성과 표준 편차의 추정치가 결정되면 SEM은 다음과 같이 계산된다.
One final useful concept concerned with post-exam analysis is the standard error of measurement (SEM). The SEM provides an estimate of the amount of error inherent in an individual's test score (Cohen & Swerdlik 2010). This estimation helps assessors to determine the discrepancies between an individual's observed score on the test and his/her true score. There is a link between the test reliability estimate and the SEM. The larger the test reliability estimate, the lower the SEM. If the estimate of the reliability of a test and its standard deviation are determined, the SEM is calculated by the following below:

SEM이 측정의 표준 오차인 경우, SD는 학생 그룹에 의한 시험 점수의 표준 편차와 같으며 r은 시험의 신뢰도 계수와 같다. 어떤 의대생이 시험에서 50점(100점 만점)을 획득했다고 가정합니다. 테스트의 [표준 편차]와 [신뢰도 계수(예: 분할-반신뢰도)]가 각각 10과 0.74인 경우 SEM은 5입니다.
Where SEM is equal to the standard error of measurement, SD is equal to the standard deviation of test scores by a group of students and r is equal to the reliability coefficient of the test. Assuming a medical student achieved a score of 50 (out of 100) on a test. If the test had a standard deviation and a reliability coefficient (e.g. split—half reliability) of 10 and 0.74, respectively, then the SEM is 5 (SEM = 10

= 5). = 5).
SEM 값을 해석하기 전에 정규 분포에서 값의 약 68%가 평균의 ±1 표준 편차 내에 있고, 값의 95%가 평균의 ±2 표준 편차 내에 있으며, 값의 99.75%가 평균의 ±3 표준 편차 내에 있다는 것을 아는 것이 도움이 됩니다. 심혈관 검사 점수의 분포가 정상이라고 가정할 때, 우리는 이제 아래와 같이 학생의 실제 점수를 추정할 수 있습니다.
Before interpreting the value of the SEM it is helpful to know that in a normal distribution roughly 68% of the values lie within ±1 standard deviation of the mean, 95% of the values lie within ±2 standard deviation of the mean and 99.75% of the values lie within ±3 standard deviation of the mean. Assuming the distribution of cardiovascular test scores is normal we can now estimate the true score for the student as shown below.
우리는 이 학생의
- 실제 점수가 50±1SEM(또는 45와 55) 내에 있다고 68% 확신할 수 있고,
- 실제 점수가 50±2SEM(또는 40과 60) 내에 있다고 95% 신뢰할 수 있으며,
- 실제 점수가 50±3SEM(또는 35와 65) 내에 있다고 99% 확신할 수 있다.
We can be 68% confident that his true score lies within 50±1SEM (or between 45 and 55), 95% confident that the true score lies within 50±2SEM (or 40 and 60) and 99% confident that the true score lies within 50±3SEM (or 35 and 65).
SEM은 또한 학생들의 시험 성적에 대한 의사 결정에도 도움을 준다. 위의 테스트에서 표준 설정자가 불합격에 대해 컷 점수를 50으로 설정하고 평가자가 자신의 결정에 68% 확신을 가지기를 원한다면 SEM은 학생의 실제 점수를 45에서 55 사이로 표시합니다. 이는 학생이 시험을 다시 치르게 되면 점수가 컷 점수(45~55점)보다 작거나 그 이상일 수 있다는 것을 의미한다. 이것은 그 학생이 시험을 통과해야 하는지 여부를 결정할 때 다른 학생들의 활동을 고려할 필요가 있음을 나타낸다.
The SEM also aids in decision making about a students’ performance on the test. If standard setters, in the above test, set a cut score for failing of 50 and if assessors want to be 68% confident of their decision, the SEM indicates that the student's true score, lies between 45 and 55. This means that if the student was to take the test again, his/her score might be less or more than the cut score (between 45 and 55). This indicates that other student activities need to be taken into account when deciding whether or not the student should pass the test.
정성항목분석
Qualitative item analysis
마지막으로 객관적인 시험 항목의 품질을 보장하는 비통계적이고 질적인 방법이 있다는 것을 알아야 한다. 시험 제작자들은 학생들이 시험에 대한 그들의 경험을 이해하는 방법에 대해 오랜 관심을 가지고 있다. 질적 방법들은 학생들이 시험 후에 그들의 경험에 붙이는 의미와 그들이 그 시험에 대해 어떻게 이해하는지 탐구하기 위해 사용될 수 있다. 연구자들은 특정 시험을 치른 학생들의 자연스러운 환경에 몰입할 수 있다. 테스트 생성자와 학생 간의 상호 작용을 탐구하는 것은 조사 중인 항목에 대한 깊은 이해의 기회를 제공합니다.
Finally it is worthwhile being aware that there are non-statistical, qualitative methods, of ensuring the quality of objective test items. Test constructors have had a long-standing interest in the way students make sense of their experiences on tests (Mosier 1947; Fiske 1967). Qualitative methods can be employed to explore the meanings students attach to their experience following a test and how they make sense of that test. Researchers can immerse themselves in the natural setting of students who have taken a particular test. Exploring the interaction between the test constructor and the student provides the opportunity for a deep understanding of the items under investigation.
정성적 방법은 심리측정학적 통계적 추론보다는 학생들의 목소리에 기반을 둔 데이터를 생성하고 분석하는 기술을 활용한다. 다시 말해, 분석 단위는 학생들의 수치 점수보다는 단어이다.
Qualitative methods utilise techniques for generating and analysing data which is grounded in the voice of students rather than psychometric-statistical inferences. In other words, the units of analysis are the words of students rather than their numerical scores.
'학생의 목소리'는 그룹 인터뷰, 대면 인터뷰 또는 관찰과 같은 다양한 언어 출처에서 얻을 수 있다. 면접의 목적은 학생들의 시험 경험에 대한 주관적인 이해를 탐구하는 것이다. 정성 테스트 생성자는 개별 테스트 항목이 어떻게 작동하는지 파악하려고 합니다. 시험 개발자는 일반적으로 질적 분석을 통해 탐색의 잠재적 영역을 파악하기 위해 개방형 및 폐쇄형 질문을 포함하는 인터뷰 일정을 구성한다. 인터뷰 일정에 포함될 수 있는 잠재적 영역은 다음과 같습니다. 문화적 인식, 시험 타당성, 시험 관리, 시험 환경, 시험 공정성, 시험 언어, 항목 추측, 학생 준비, 시험 중 학생들의 편안함, 시험 기간, 시험 시간 및 학생의 전반적인 인상.
‘The student voice’ can be gleaned from different verbal sources such as group interviews, face to face interviews or observations. The purpose of the interview is to explore students’ subjective understanding of their test-taking experience. Qualitative test constructors seek to uncover how individual test items work. Test developers usually construct an interview schedule containing open and closed questions to uncover potential areas of exploration by means of qualitative analysis. The potential areas that may be contained in the interview schedule are: cultural awareness, test validity, test administration, test environment, test fairness, test language, item guessing, student preparation, student's comfort during the test, test length, test time and overall impression of the student (Cohen & Swerdlik 2010).
'Think aloud' 시험관리는 시험 운영 중 각 항목이나 기술에 대한 학생들의 반응을 파악하기 위한 관찰 질적 연구 도구이다. 이 접근법에서, 학생들은 시험에 참여하도록 요청 받고, 그들이 각 항목이나 기술에 반응할 때 그들이 느끼고 생각하는 것을 표현하도록 한다. 시험관들은 시험 중에 학생들의 발언을 객관적으로 기록하거나 중단 없이 녹음한다. 자료의 전사 및 분석은 질적 연구 방법을 사용하여 수행된다. 학생들의 이러한 언어화는 학생들이 어떤 항목을 어떻게 해석하는지, 그리고 그들이 어떤 항목을 잘못 해석하는 이유와 방법을 더 잘 이해하는 데 도움이 될 수 있다(Cohen & Swerdlik 2010).
‘Think aloud’ test administration is an observation qualitative research instrument to uncover student's responses to each item or skill during the administration of a test. In this approach, students are asked to take part in a test and then express whatever they are feeling and thinking when they are responding to each item or skill. Examiners make objective notes of students’ utterances or audio-record them, without interruption, during the test. Transcriptions and analysis of the materials is carried out using qualitative research methods. Such verbalisations by students may help examiners to better understand how students interpret an item, as well as why and how they are misinterpreting an item (Cohen & Swerdlik 2010).
그러나 학생들의 점수가 면접 중 질문에 대한 그들의 반응에 영향을 미칠 수 있다는 점에 유의해야 한다. 좋은 점수를 받은 사람들은 긍정적으로 반응할 수 있고, 나쁜 점수를 받은 사람들은 시험 개발자들을 비난할 수 있다. 질적 데이터의 해석은 모든 학생들의 경험을 고려해야 한다. 이러한 해석에 기초하여 심사관이나 시험 개발자는 항목을 수정, 재작성 또는 폐기할 수 있다.
It should be noted, however, that students’ scores may influence their responses to the questions during interview. Those who have received good scores may respond positively and those who have received poor scores may criticise test developers. The interpretation of qualitative data should take all student experiences into consideration. Based on these interpretations, examiners or test developers can revise, reword or discard an item.
요약
Summary
본 가이드에서는 의학교육에서 측정 및 평가의 중심적 중요성과 시험문제의 추론기반을 설명하였다. 의학 교육자들은 학습에 대한 학생들의 참여를 촉진하는 데 세 가지 주요 역할을 한다.
- 첫째, 그들은 의대생들이 무엇을 해야 하는지 또는 무엇을 알아야 하는지에 초점을 맞춘 학습 목표에 대한 결정을 내려야 한다.
- 둘째, 의료교육자는 교육관리 및 리더십 기법과 교육학적 방법을 이용하여 의료환경이나 교실에서 대상주제를 구현하고 가르칠 필요가 있다.
- 마지막으로, 의학 교육자들은 특정 성취도 테스트를 통해 얼마나 많은 양의 자료를 습득했는지 측정하고 평가할 필요가 있다.
This Guide has explained the central importance of measurement and evaluation and inferential foundations of examination questions in medical education. Medical educators have three key roles in facilitating student engagement in learning.
- First, they need to make a decision about learning objectives which focuses on what medical students need to do or know.
- Second, medical educators need to implement and teach the target subject matter in health care settings or the classroom using educational management and leadership techniques and pedagogical methods.
- Finally, medical educators need to measure and evaluate how much of the material has been mastered by a particular achievement test.
시험은 보통 특정 과목의 학생 성취도 기준으로 간주된다. 따라서 의료 교육자는 검사 문제가 의도한 목적에 적합한 증거를 도출하도록 유효하고 신뢰할 수 있는 시험을 구성해야 한다. 이를 위해 항목-난이도 지수 및 항목-차별 지수를 산출할 필요가 있다. 문제는 대다수(60% 이상) 학생이 맞히면 쉬운 것으로, 30% 미만 학생이 맞히면 어려운 것으로 간주된다. 항목 판별 지수는 점-이진 상관 계수 및 t-테스트 절차를 사용하여 분석한다. 큰 양의 Rpbi는 좋은 질문의 표시이고 낮은 양의 Rpbi 또는 음의 Rpbi는 나쁜 질문의 표시입니다. t-검정은 항목 식별 지수를 결정하기 위한 또 다른 통계적 절차이다. 문제를 맞힌 학생의 평균점수와 오답한 학생의 평균점수 사이에 큰 차이가 없다면 문제는 강한 학생과 약한 학생을 구별하는 것이 아니다. 이는 다음 시험을 위해 문제를 제거하거나 수정해야 함을 시사한다. SPSS는 항목 분석 데이터의 분석을 용이하게 한다.
This test is usually considered as a criterion for student achievement in a particular subject. Consequently, medical educators need to construct valid and reliable tests in order to ensure that examination questions elicit evidence that is appropriate to the intended purpose. To this end, the item-difficulty index and the item- discrimination need to be calculated. A question is considered easy if it is answered correctly by the majority of students (more than 60%), and is considered hard if it is answered correctly by less than 30% of the students. The item-discrimination index is analysed using the point-biserial correlation coefficient and the t-test procedure. A large positive Rpbi is an indication of a good question while a low positive or a negative Rpbi is an indication of a bad question. The t-test is another statistical procedure for determining the item-discrimination index. If there is no significant difference between the mean score of students who answered the question correctly and the mean score of students who answered the question incorrectly, the question is not differentiating strong students from weak students. This suggests that the question should be removed or revised for next examination. SPSS facilitates the analysis of the item analysis data.
Post-examination analysis of objective tests
PMID: 21609174
Abstract
One of the key goals of assessment in medical education is the minimisation of all errors influencing a test in order to produce an observed score which approaches a learner's 'true' score, as reliably and validly as possible. In order to achieve this, assessors need to be aware of the potential biases that can influence all components of the assessment cycle from question creation to the interpretation of exam scores. This Guide describes and explains the processes whereby objective examination results can be analysed to improve the validity and reliability of assessments in medical education. We cover the interpretation of measures of central tendency, measures of variability and standard scores. We describe how to calculate the item-difficulty index and item-discrimination index in examination tests using different statistical procedures. This is followed by an overview of reliability estimates. The post-examination analytical methods described in this guide enable medical educators to construct reliable and valid achievement tests. They also enable medical educators to develop question banks using the collection of appropriate questions from existing examination tests in order to use computerised adaptive testing.
'Articles (Medical Education) > 평가법 (Portfolio 등)' 카테고리의 다른 글
| 검은 백조를 찾아서: 의사국가시험 불합격 위험 학생 식별 (Acad Med, 2017) (0) | 2022.09.20 |
|---|---|
| 객관식 시험 자료의 사후 분석 - 고부담 시험 모니터링 및 개선: AMEE Guide No. 66 (Med Teach, 2012) (0) | 2022.09.09 |
| 수행능력 기반 평가에서 합격선 설정 방법: AMEE Guide No. 85 (Med Teach, 2014) (0) | 2022.09.09 |
| 평가자의 합격선설정과정에 대한 이해와 수행능력을 지원하기 위한 피드백(Med Teach, AMEE Guide No. 145) (0) | 2022.09.07 |
| 교육적 평가의 타당화: 시뮬레이션 등을 위한 프라이머(Adv Simul (Lond). 2016) (0) | 2022.08.19 |