평가자의 합격선설정과정에 대한 이해와 수행능력을 지원하기 위한 피드백(Med Teach, AMEE Guide No. 145)
Feedback to support examiners’ understanding of the standard-setting process and the performance of students: AMEE Guide No. 145
Mohsen Tavakola, Brigitte E. Scammella and Angela P. Wetzelb

서론
Introduction
인간이 다른 인간을 평가하는 경우, 많은 요소들이 그들의 주관적인 판단을 흐리게 할 수 있다. 평가된 콘텐츠 영역의 불확실성 또는 평가 상황에서 입증되는 예상 지식 및 기술 수준에 대한 명확성의 결여는 측정 오류를 초래할 수 있는 잠재적인 편견의 원천이다. 교육 시스템에서, 정확한 학생 평가는 어려울 수 있지만 공정한 측정을 위해 필수적이며 학생들의 점수에서 적절한 추론을 도출할 수 있도록 보장하는 데 필수적이다.
In instances where humans rate other humans, many factors can cloud their subjective judgments. Uncertainty in the content area assessed personal biases or lack of clarity on expected levels of knowledge and skills demonstrated in a rating situation are potential sources of bias that may lead to measurement error. In educational systems, accurate student assessment can be challenging but is essential for fair measurement and is essential to ensuring appropriate inferences can be drawn from students’ scores.
'[공정성]은 [시험 응시자의 구인-무관한 개인적 특성]이 [시험 결과나 해석]에 유의미한 영향을 미치지 않도록 요구한다.' (ETS) 2002. 구성-무관 분산CIV은 체계적인 측정 오류의 원인입니다(Haladyna 및 Downing 2005). CIV는 관련 성과 측정과 무관한 체계적인 오류로서, 인플레이션이나 등급 하락으로 인해 실제 점수에 영향을 미칠 수 있다(Lord and Novick 1968). 또한 체계적인 오류는 점수의 오역misinterpretation으로 이어져 시험 점수의 타당성을 제한할 수 있다.
‘Fairness requires that construct-irrelevant personal characteristics of test-takers have no appreciable effect on test results or their interpretation’ (Educational Testing Service (ETS)) 2002). Construct-irrelevant variance is a source of a systematic measurement error (Haladyna and Downing 2005). This systematic error, unrelated to measuring the relevant performance, can influence true scores due to inflation or deflation of ratings (Lord and Novick 1968). Further, systematic errors can lead to misinterpretation of scores, limiting test score validity.
객관 구조화 임상 검사(OSCE)와 입학 OSCE(MMI)는 [체계적인 오류systematic errors]로부터 면역되지 않는다. 예를 들어, 이러한 의료 교육 맥락에서,
- 스테이션 불규칙성 또는 스테이션의 결함
- 일반적인 평정 오류(예: 관용 오류, 심각도 오류, 중심 경향 오류, 후광 효과, 불일치),
- 하위 그룹을 위해 제작된 스테이션의 불공정성
- 강건한 합격점의 결여
...은 모두 구성 무관 분산CIV의 잠재적 원천이다. CIV는 다음의 것들을 저하시킬 수 있다.
- 시험 점수 해석의 관련성과 적절성,
- 시험 점수에 기초한 결정의 정당성
- 시험 점수에 대한 외부 타당성 증거
Objective Structured Clinical Examinations (OSCEs) and admission OSCEs (Multiple Mini- Interviews) are not immune from systematic errors. For example, in these medical education contexts,
- station irregularities or flawed stations,
- common errors in ratings (e.g. generosity error, severity error, central tendency error, halo effect, inconsistency),
- the unfairness of stations crafted for subgroups, and
- a lack of a robust pass mark
...are potential sources of construct-irrelevant variance. The sources of construct-irrelevant variance could minimise
- the relevance and appropriateness of test score interpretations,
- the legitimacy of a decision based on test scores and
- the external validity evidence for test scores (Downing 2002).
CIV에 기여하는 대부분의 오류는 [각 검사자가 학생 및 검사자 간의 성과 등급에 대한 데이터를 받는] [검사자 교육 및 개별화된 교정 피드백]을 통해 최소화할 수 있다. [개별화된 피드백]은
- 동일한 학생을 평가하는 여러 평가자의 일관성을 개선하고,
- 관찰자 간 신뢰성과 공정성을 지원하며,
- 점수 해석에 대한 신뢰도를 높일 수 있다.
Most of the errors that contribute to construct-irrelevant variance can be minimised through examiner training and individualised calibration feedback where each examiner receives data on their performance ratings across students and between examiners. Individualised feedback could
- improve the consistency of multiple raters assessing the same student,
- supporting inter-observer reliability and fairness, and
- enhancing confidence in score interpretations.
[공정한 평가]는 '모든 시험 응시자에 대해 [동일한 구인]을 반영하며, 그 결과 점수는 [의도된 모집단의 모든 개인]에게 [동일한 의미]를 갖는다'(American Educational Research Association, A. P. A. & National Council on Measure in Education 2014)이다. 이 가이드의 목적은 평가를 공정하고 유효하며 신뢰할 수 있도록 하기 위한 노력으로 [학생 성과 및 표준 설정 프로세스]에 대한 [examiner의 관찰과 평가]를 지원하기 위해 [개인화된 피드백]을 위한 다양한 방법을 제공하는 것이다. 여기에는 심사관의 성과 변동성, 경계선 학생, 등급 정확도, 등급 정확도 향상을 위한 피드백, 표준 설정자와 OSCE 심사관 모두를 위한 다양한 접근 방식을 사용하는 심판에게 피드백을 시각화하는 내용이 포함된다.
A fair assessment is one that ‘reflects the same construct(s) for all test takers, with scores from it having the same meaning for all individuals in the intended population’ (American Educational Research Association, A. P. A., & National Council on Measurement in Education 2014). The purpose of this Guide is to provide various methods for individualised feedback to support examiners’ observations and evaluations of student performance and the standard-setting process with an effort to make assessments fair, valid and reliable. It will cover the following topics:
- performance variability of examiners,
- the borderline students,
- rating accuracy,
- feedback to improve rating accuracy,
- visualising feedback to judges using different approaches, both for standard setters and OSCE examiners.
심사관의 성과 변동성
Performance variability of examiners
학생들의 실력을 평가할 때, 많은 요소들이 [학생들의 진점수true score]에 영향을 미친다. OSCE 시험에서, 이상적으로, 학생들의 성과는 그들이 글로벌 등급 척도 및 체크리스트 점수로 받은 등급과 일치해야 한다. 그러나 [민족성, 성별, 시험관 엄격성/관용성, 측정되는 현상과 관련한 시험관 배경]과 같은 [평가자의 인구통계학적 특성]이 학생 점수에 영향을 미칠 수 있기 때문에 편향이 발생할 수 있다. 이러한 [평가자 특성]은 측정에 구성 무관 분산CIV을 추가하여 실제 점수에 비해 점수가 증가하거나 감소할 수 있습니다. [학생 수행]은 학생의 평가 등급이 [학생의 수행]보다 [평가자의 특성]이 더 반영되는, [독특한 평가자 효과idiosyncratic examiner effect]의 함수가 되어서는 안 된다. 결과 점수는 학생의 성과를 반영해야 하며, [독특한 검사 경험의 영향]을 최소화해야 한다. 시험관은 [합격선 설정] 및 [학생 성취도 측정] 모두에서 중요한 역할을 하므로, 각 역할에 대한 교육은 두 영역 모두에서 중요하며 별도로 논의된다.
In assessing students’ skills, many factors affect the true score of students. In OSCE exams, ideally, student performance should be matched with the ratings that they receive from the global rating scale and checklist scores. However, this may not happen as examiner demographic characteristics, such as ethnicity, gender, examiner stringency/leniency, and examiner background with the phenomenon being measured may affect student scores. Such examiner characteristics could add construct-irrelevant variance to measurement, resulting in increased or decreased scores relative to the true score. Student performance should not be a function of the idiosyncratic examiner effect, where the examiner rating of a student is a reflection of their characteristics rather than the student’s performance. Outcome scores should reflect student performance and be affected minimally by the idiosyncratic examiner experience. Examiners play an essential role in both setting the standard and measuring student performance; therefore, training for each role is important in both areas and is discussed separately.
표준 설정
Standard-setting
[합격선 설정 과정]은 지식 기반 테스트와 OSCE를 포함하여, 표준 설정자가 특정 테스트에 대한 합격점을 계산하는 방법을 포함한다. 평가 제공자, 학생 및 평가 결과 이용자의 마음속에 있는 질문은 '얼마면 충분할까?'이다(Cusimano 1996). 표준 설정자들은 [능력 있는 사람]과 [능력 없는 사람]을 구별하는 기준을 설정하기 위해 다른 방법을 사용한다. 알려진 표준 설정 방법이 다른 곳에서 잘 설명되기 때문에, 여기서는 설명하지 않는다. 관심 있는 독자는 다른 AMEE 가이드(Ben-David 2000; McKinley and Norcini 2014)에서 표준 설정 방법에 대한 추가 정보를 찾을 수 있습니다.
The standard-setting process involves a method in which standard setters calculate a pass mark for a particular test, including knowledge-based tests and OSCEs. The question in the minds of assessment providers, students and users of assessment outcomes is ‘how much is enough?’ (Cusimano 1996). Standard setters use different methods to establish the standard to discriminate competent from incompetent. Given that the known methods of setting standards are well described elsewhere, they are not discussed here. Interested readers can find further information about standard-setting methods in other AMEE Guides (Ben-David 2000; McKinley and Norcini 2014).
경계선 그룹
The borderline group
[경계선에 있는 학생(때로는 최소 능력 학생minimally competent student으로 불림)]을 판단하는 것이 표준 설정 과정의 초석이다. 예를 들어, 앙고프 방법과 에벨 방법에서 표준 설정자들은 [가상의 경계선 그룹]의 특징을 선언한다. 다음으로, 그들은 경계선에 있는 학생이 [각 항목에 올바르게 답할 확률]을 추정합니다. 각 표준 설정자는 해당 그룹에 대한 자체적인 자의적 판단을 가지고 있습니다. 우리가 아는 한, 표준 설정 문헌에는 경계선이나 최소한의 능력 있는 학생에 대한 [경험적 정의가 없다]. 전형적으로 합격점 주변에 성적 수준이 있는 학생들은 경계선 그룹이지만, 경계선 그룹을 경험적으로 연구하기 위해서는 얼마나 가까운지(예: 1% 이내, 2% 이내 또는 표준 측정 오차(SEM))에 대해 [임의의 범위]를 만들어야 한다. 예를 들어, 합격 표시 주변의 경계선 점수 범위를 식별할 수 있습니다. 다음으로, 1 SEM 이하에서 1 SEM 이상까지의 범위에 있는 학생은 경계선으로 간주됩니다.
Judging a borderline student (sometimes called a minimally competent student) is the cornerstone of the standard-setting process. For example, in the Angoff method and the Ebel method, standard setters declare the features of a hypothetical borderline group of students. Next, they estimate the probability that a borderline student will answer each item correctly. Each standard-setter has their own arbitrary judgment of that group. To our knowledge, there is no empirical definition of borderline or minimally competent students in the standard-setting literature. Typically, the students who have a performance level around the pass mark are the borderline group, but we have to make an arbitrary range for how close, (e.g. within 1%, 2% or within a standard error of measurement (SEM)) in order to study the borderline groups empirically. For example, we could identify a range of borderline scores around the pass mark. Next, students who lie within the range from one SEM below to one SEM above the pass mark are considered borderline.
표준 설정 문헌에서는 '경계선 또는 최소 역량'의 개념에 대한 의문이 제기되어 왔다. 예를 들어, 표준 설정자는 정확하고 일관된 표준을 확립할 수 있는 능력을 가지고 있는가? (Glass 1978). [표준 설정자]나 [표준 설정 방법]이 변경되면 합격 점수가 영향을 받아 합격점의 신뢰성과 안정성에 부정적인 영향을 미칠 수 있다(Meskauskas 및 Webster 1975). 더 중요한 것은, 구인 무관 분산CIV이 측정에 도입될 수 있다는 것이다. 계산된 표준이 합리적이고 방어 가능한 결과를 생성하는 경우(합격 횟수가 너무 많거나 실패 횟수가 많지 않은 경우) 변덕스럽지 않은 표준을 보장하기 위해 표준 설정 문헌에 알려진 방법을 따를 필요가 있다(예: Cizek 2006, Skorupski 2012). Standards for Educational and Psychology Testing 는 이렇게 말한다:
Questions about the concept of ‘borderline or minimal competence’ have been raised in the standard-setting literature. For example, do standard setters have the ability to establish an accurate and consistent standard? (Glass 1978). When the standard setters or standard-setting methods are changed, the passing score can be affected, negatively impacting the credibility and stability of the pass mark (Meskauskas and Webster 1975). More importantly, the construct-irrelevant variance may be introduced to measurement. To ensure standards that are not capricious, where the calculated standard produces a reasonable and defensible outcome (not too many passes and not too many fails), it is necessary to follow the known methods in the standard-setting literature (e.g. Cizek 2006, Skorupski 2012). Standards for Educational and Psychology Testing state:
- 합격선 설정 절차를 따른다면,
- 채택된 방법을 명확히 기술하고,
- 요구된 판단의 정확한 성격을 제시해야 한다.
- 절차의 문서화 시에는 다음을 포함해야 한다.
- Judges의 선택과 자격,
- 제공되는 훈련,
- 임시 판결의 함의에 대한 심판에게 주어진 피드백,
- 판결자가 서로 협의할 수 있도록 주어진 기회
- 해당되는 경우 판결자의 변동성variability over judges을 보고해야 한다.
- 가능하다면, 만약 이 합격선 설정 절차를 [반복할 경우에 예상할 수 있는 컷 점수 변동의 양에 대한 추정치]가 제공되어야 한다.
- ‘If a judgmental standard-setting process is followed,
- the method employed should be clearly described, and
- the precise nature of the judgments called for should be presented.
- Documentation should also include
- the selection and qualification of judges,
- training provided,
- any feedback to judges concerning the implications of their provisional judgments, and
- any opportunities for judges to confer with one another.
- Where applicable, variability over judges should be reported.
- Whenever feasible, an estimate should be provided of the amount of variation in cut scores that might be expected if the standard-setting procedure were replicated’ (American Educational Research Association, A. P. A., & National Council on Measurement in Education 2014).
앙고프법
Angoff method
판단적 접근법(네델스키 1954; 앙고프 1971; 에벨 1979; 예거 1989) 내에서 [앙고프 표준 설정 방법]은 의학 교육 평가에 널리 사용되고 있으며, 계산된 합격 앙고프 점수는 [허용 가능한 성과]와 [허용되지 않는 성]과 사이의 경계로 이어진다. 앙고프 방법의 기원은 앙고프가 아니라 레드야드 터커(미국 심리학자)에게 있다. 그러나 1971년 Angoff는 Educational Measurement 라는 책의 각주에 각 표준 설정자가 다음과 같이 진술하도록 요청받는 절차를 썼다.
Within the judgmental approaches (Nedelsky 1954; Angoff 1971; Ebel 1979; Jaeger 1989), the Angoff standard-setting method is widely used in medical education assessment, and the calculated passing Angoff score leads to the boundary between the acceptable and unacceptable performance. The origin of the Angoff method lies not with Angoff, but Ledyard Tucker (American Psychometrician); yet, in 1971, Angoff, wrote in a footnote in the book Educational Measurement a procedure in which each standard setter is asked to state:
- '최소한의 수용가능한 사람'이 각 항목에 정확하게 답할 확률'. 실제로, judges은 그러한 한 사람만이 아닌, [다수의 최소 수용 가능한 사람들]을 생각할 것이고, [정답을 맞출 수 있는 최소 수용 가능한 사람들의 비율]을 추정할 것이다. 이러한 확률 또는 비율의 합은 최소 허용 점수를 나타냅니다(515페이지).
- ‘the probability that the “minimally acceptable person” would answer each item correctly. In effect, the judges would think of a number of minimally acceptable persons, instead of only one such person, and would estimate the proportion of minimally acceptable persons who would answer correctly. The sum of these probabilities, or proportions, would then represent the minimally acceptable score, (p. 515)’
Angoff의 운영 정의는 이 접근법의 단순성을 보여주지만, 이 접근 방식은 표준 설정자가 경계선 학생에 대해 갖는 주관적 해석에서 오류의 위험에 남아 있다. 또한, 경험적 연구에 따르면 표준 설정자는 [항목에 대한 경계선 학생의 성과를 과소평가하거나 과대평가]하여, 경계선 학생을 정확하게 평가하는 데 어려움을 겪고 있다(Impara and Plake 1998; Goodwin 1999; Clauser et al. 2002; Clauser et al. 2008). 이는 Angoff 접근 방식이 '임의적이고 명확성이 부족함'임을 시사한다(Stone et al. 2011).
Angoff’s operational definition shows the simplicity of this approach, and yet the approach remains at risk of error in the subjective interpretations that standard setters have of borderline students. Further, empirical studies show that standard setters struggle to accurately rate borderline students, underestimating or overestimating the performance of borderline students on items (Impara and Plake 1998; Goodwin 1999; Clauser et al. 2002; Clauser et al. 2008), suggesting the Angoff approach to be ‘random and lacking in clarity’ (Stone et al. 2011).
경계선 그룹과 Angoff 방법 접근법에 대한 이러한 비판은 표준 설정자 간의 변동variation이 [설정될 표준]을 손상시킬 수 있고, 따라서 평가된 점수의 정확성을 손상시킬 수 있다는 사실에 관심을 갖게 한다. 즉, 표준 설정자의 통과 점수 사이에 상당한 차이가 있을 경우 이러한 방법을 사용하지 말아야 함을 시사한다.
These criticisms of the borderline group and Angoff method approaches draw our attention to the fact that the variation among standard setters could compromise the set standard and thus the accuracy of assessed scores, suggesting these methods should not be used if there is a significant difference between the standard setters’ passing scores.
등급 정확도를 높이기 위한 표준 설정자에 대한 피드백
Feedback for standard-setters to improve rating accuracy
표준 설정자 교육은 표준 설정 프로세스의 필수적인 부분이며, 피드백은 훈련의 필수적인 부분입니다. 표준 설정자에게 피드백을 제공하는 것은 측정 오차의 영향을 더 잘 이해하고(또는 적어도 고려하고), 안정적인 표준을 추정할 수 있는 기회를 제공한다(Recase 및 Chen 2012). Angoff 방법과 경계선 그룹 접근법으로 이전에 논의된 한계를 고려할 때, 표준 설정자의 성능에 대한 피드백은 후속 검사 정확도에 긍정적인 영향을 미칠 수 있다. 특히, 표준 설정자 내 불일치intrastandard-setter discrepancies [(무효 항목의 출처), (린덴 1982)]는 표준 설정자 간 결과를 공유하여 식별할 수 있다. 이러한 피드백 데이터는, 그 자료를 개별로 검토하고 그룹 토론을 통해 보정함으로써, 경계 그룹 및 컷 스코어 설정을 개선할 수 있습니다. 표준 설정자에게 [다른 표준 설정자에 대한 등급과 비교한 피드백]을 제공하면 합격 표시에 부착된 오류를 줄일 수 있다. 또한 피드백을 통해 표준 설정자는 추정 합격 점수를 신뢰할 수 있고 방어할 수 있는지 확인하고 [앙고프 등급]의 신뢰성과 유효성을 개선할 수 있다.
Standard-setter training is an integral part of the standard-setting process, and feedback is an essential part of the training. Giving feedback to standard setters provides an opportunity for them to understand better the impact of measurement error (or at least consider it) and estimate a stable standard (Reckase and Chen 2012). Given the previously discussed limitations with the Angoff method and borderline group approach, feedback on standard setters’ performance may have a positive effect on subsequent examiner accuracy. Specifically, intrastandard-setter discrepancies [(a source of invalidating items), (Linden 1982)], can be identified with results shared with standard setters. These feedback data, reviewed at the individual level and calibrated through group discussion, can improve borderline group and cut score setting. Providing standard setters with feedback about their ratings relative to other standard setters may reduce the error attached to the pass mark. Furthermore, feedback allows standard setters to ensure that the estimated passing scores are credible and defensible and improve the credibility and validity of Angoff ratings.
[피드백의 목적]과 [표준 설정자에 대한 이러한 방법이 얼마나 소화 가능한지]에 따라, 피드백을 제공하는 여러 가지 접근법이 있다. 전반적으로, 피드백의 궁극적인 목표는 표준 설정자들이 [경계선 학생들의 개념화]에 대한 그들의 [등급을 재고할 수 있는 기회]를 제공하는 것이다. 피드백은 [계산된 합격점수]가 아니라 [심판들judges의 변동성]에 초점을 맞춰야 한다는 점에 유의해야 한다(Hambleton et al. 2012). 피드백은 표준 설정자가 항목을 검토 및 토론하고 경계선 학생을 위한 항목 추정치를 작성할 때 표준 설정자에게 제공될 수 있으며, [표준 설정 회의]를 시작하기 전의 공식 훈련시간 중에 피드백을 공유할 수 있다. 자세한 내용에 관심이 있는 독자는 AMEE Guide No 119(타바콜과 데닉 2017)를 참조할 수 있다. 아래에서, 우리는 다른 접근 방식을 가진 피드백의 형태에 대해 논의한다. 시각화된 모든 데이터는 가상적이며 R 프로그래밍 코드로 작성된다는 점에 유의해야 한다. 프로그래밍 코드로부터 더 많은 정보를 수신하는 데 관심이 있는 사람들은 해당 작성자에게 연락할 수 있다.
There are several approaches to provide feedback, depending on the purpose of the feedback and how digestible these methods are for standard setters. Overall, the ultimate goal of feedback is to provide an opportunity for standard setters to reconsider their ratings on borderline students’ conceptualisation. It should be noted that feedback should focus on judges' variability, not the calculated pass mark (Hambleton et al. 2012). Feedback could be provided to standard-setters at the time they review and discuss items and make item estimates for borderline students, or feedback could be shared during formal training prior to starting the standard-setting meeting. Readers interested in more details can refer to AMEE Guide No119 (Tavakol and Dennick 2017). Below, we discuss the forms of feedback with different approaches. It should be noted that all visualised data are hypothetical and written with R programming codes. Those who are interested in receiving more information from the programing codes may contact the corresponding author.
기술 통계량
Descriptive statistics
표준 설정자 피드백을 포함하여, 모든 연구의 데이터에 대한 [기술 통계]는 데이터 시각화를 용이하게 하므로 결과에 대한 간단한 해석을 제공한다. 표준 설정자와 평균 항목 난이도를 포함한 학생들의 수행에 대한 서술적 통계를 공유하면 피드백 과정에 도움이 될 수 있다. 합격점을 나타내는 그래프 내에 수직선과 함께 학생들의 점수 분포의 히스토그램 그래프를 그리면 심사위원들은 그들이 설정한 합격점과 관련하여 학생들의 점수 분포를 더 깊이 이해할 수 있다. 가장 중요하게는, [항목과 시험의 평균 항목 난이도 값을 제공]하는 것은 표준 설정자들에게 [시험이 얼마나 어려운지]를 말해준다. 표준 설정자는 평균 항목 난이도(전체 시험의 난이도)를 기준으로 개별 항목의 난이도를 비교할 수 있었다. 게다가, 그들은 확립된 합격 점수와 문항들의 평균 난이도를 비교할 수 있다. 난이도 항목 지수는 AMEE Guide No. 54번에서 객관적 시험의 사후 분석(Tavakol and Dennick 2011)에 설명되어 있다.
Descriptive statistics of data in any research study, including standard-setters feedback, facilitate data visualisation and thus provide a simple interpretation of the results. Sharing the descriptive statistics of students’ performance, including the mean item difficulty with standard setters, can help in the feedback process. Plotting a histogram graph of students’ mark distribution along with a vertical line within the graph indicating the passing mark allows judges to gain a deeper understanding of the distribution of students’ marks in relation to the passing mark they established. Most important, providing the mean item difficulty value of the items and test tells the standard-setters how difficult the test was for the students. Standard setters could compare individual items’ difficulty based on the mean item difficulty (the overall test’s difficulty). In addition, they can compare the established passing score with the average difficulty of the questions. In AMEE Guide No. 54, the difficulty item index is explained in the Post-Examination Analysis of Objective Tests (Tavakol and Dennick 2011).
오차 막대 차트
Error-bar charts
[오차 막대]는 표준 설정자에게 피드백을 제공하는 강력한 도구입니다. 오류 막대를 사용하면 표준 설정자가 제공하는 Angoff 등급을 비판적으로 평가할 수 있다. 오차 막대는 측정 오차가 아니라 평균 주변의 데이터 범위 또는 산포를 나타내는 T자형 막대입니다(즉, 표준 편차). 오류 막대는 또한 경계선 학생을 좁거나 광범위하게 등급을 매긴 표준 설정자에게 주의를 끌기 위해 사용될 수 있다.
- [작은 T자 모양]의 막대는 데이터 점(Angoff 등급)이 평균에 가깝다는 것을 알려주고,
- [큰 T자 모양]의 막대는 데이터 점이 평균과 구별된다는 것을 알려줍니다.
Errors bars are powerful tools for providing feedback to standard setters. Error bars allow us to critically assess the Angoff ratings provided by the standard setters. An error bar is a T-shaped bar representing a range or spread of data around the mean (i.e. standard deviation), not a measurement error. The error bar can also be used to draw attention to standard setters who rated borderline students narrowly or broadly.
- A small T-shaped bar tells us data points (Angoff ratings) are close to the mean, and
- a large T-shaped bar tells us data points are distinct from the mean.
그림 1은 Angoff 방법에서 모든 항목과 표준 세터의 평균 추정(검은색 원)과 표준 세터 간의 변동성에 대한 피드백의 예를 보여준다. 점선은 계산된 합격점를 나타냅니다. X축은 표준 세터(N = 10)를 나타내고 Y축은 모든 항목의 평균 등급을 나타냅니다. X축 번호는 표준 세터의 코드이므로 이 그림을 사용하여 합격 점수를 결정하는 데 관련된 모든 표준 세터에 기밀 등급을 표시할 수 있습니다. 표준 설정자는 자신에게 주어진 코드를 알고 있어야 한다. 예를 들어, 표준 설정자 1과 5는 막대 차트에서 코드를 찾고 항목에 대한 평균 추정 등급이 다른 표준 설정자와 다르다는 것을 확인할 수 있습니다. 그러나 세터 1과 5는 다른 표준 세터보다 자체 추정에서 여전히 더 동질적이라는 것을 보여주는 작은 T 모양의 막대를 가지고 있습니다. 표준 세터 6, 8, 9는 다른 표준 세터에 비해 큰 T자형 막대를 가지고 있다. 앞서 언급한 바와 같이, 이는 표준-세터 간 불일치를 암시할 수 있으며, 결과적으로 서로 다른 합격점을 초래할 수 있다. 예를 들어, 쉬운 문제에서는 경계선 학생의 낮은 앙고프 평점과 어려운 문제에서는 높은 앙고프 평점이 그것이다. 이 두 등급은 일정하지 않다. 전자는 낮은 통과 점수를 초래하는 반면, 후자는 높은 통과 점수를 초래한다(린덴 1982). 높은 등급은 표준을 위로 밀어 올리고 낮은 등급은 표준을 아래로 밀어냅니다. 주목할 점은, 때때로 표준 설정자가 등급에 확신을 가지고 있다면 등급의 불일치가 있어도 방어가능하다는 것이다(Recase와 Chen 2012).
Figure 1 shows an example of feedback about the mean estimation (black circles) of all items and standard setters and the variability among standard setters in the Angoff method. The dashed line represents the calculated pass mark. The X-axis represents the standard setters (N = 10), and the Y-axis represents the average ratings of all items. The X-axis numbers are the standard setters' codes, so this plot can be used to present confidential ratings to all the standard setters involved in determining the passing score. Standard setters should be aware of the code given to them. For example, standard setters 1 and 5 can look for their code in the bar chart and see that their average estimation rating for the items is different from other standard setters. However, setters 1 and 5 have small T-shaped bars showing they are still more homogeneous in their own estimations than other standard setters. Standard setters 6, 8 and 9 have large T-shaped bars compared to other standard setters. As previously noted, this may suggest intrastandard-setter inconsistency, subsequently resulting in different pass marks. For example, a low Angoff rating for a borderline student on an easy question and a high Angoff rating on a hard question. These two ratings are not consistent. The former results in a low pass mark, whereas the latter results in a high pass mark (Linden 1982). High ratings push the standard upwards, and low ratings push the standard downwards. Of note, sometimes inconsistencies in ratings are defendable if the standard setters are confident in their ratings (Reckase and Chen 2012).
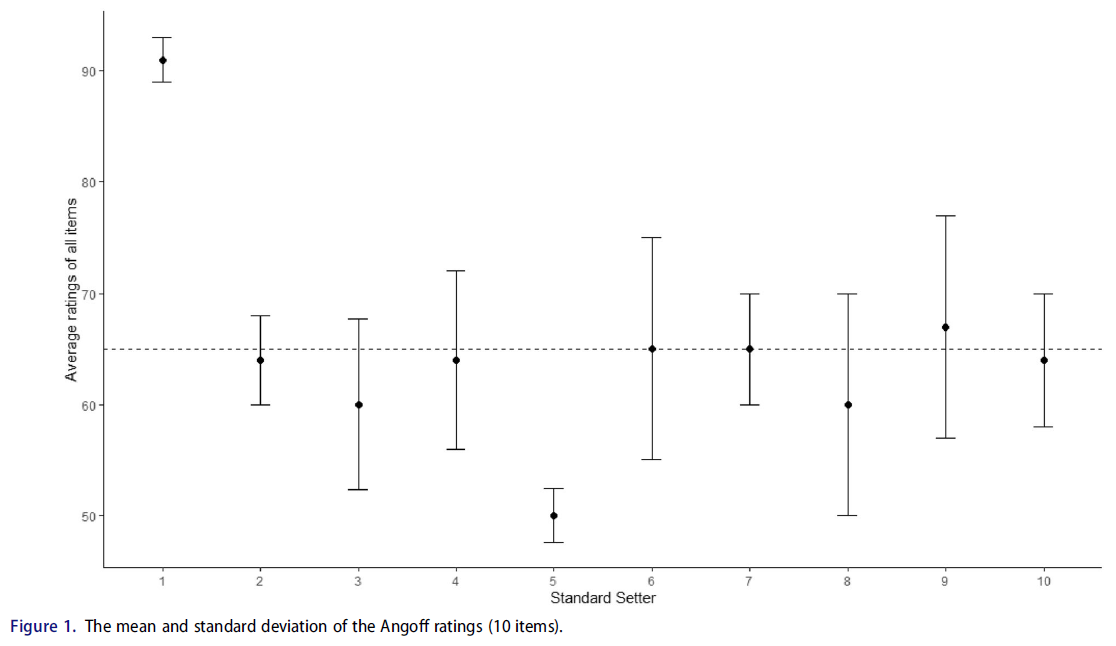
그림 1은 또한 각 라운드의 표준 설정 프로세스 동안 사용될 수 있으며, 표준 설정자가 과제와 경계선 학생의 개념화에 대한 피드백을 받을 수 있다. 과제에 익숙하지 않거나, [경계선 학생을 개념화하기 어려워하는 사람들]은 다른 표준 설정자에 비해 [극단적인 앙고프 등급]을 제공하는 경향이 있다는 점을 언급할 가치가 있다(Recase 및 Chen 2012).
Figure 1 can also be used during the standard-setting process for each round, allowing standard-setters to receive feedback about the task and the conceptualisation of borderline students. It is worth stating that those who are not familiar with the task and struggle to conceptualise borderline students tend to provide extreme Angoff ratings compared to other standard setters (Reckase and Chen 2012).
평균 정격에서 표준 설정자의 위치
Location of the standard setters on the mean ratings
표준 설정자에게 피드백을 제공하는 또 다른 시각화 방법은 각 설정자의 표준과 시험에 대해 계산된 합격 점수를 척도로 찾는 것이다(Recase 및 Chen 2012). 그림 2는 표준 세터의 분포를 각각의 알파벳 코드와 함께 보여준다. 검정색 선은 시험에 대한 식별된 합격 표시이다.
Another visualisation method to give feedback to standard setters is to locate, on a scale, the standard for each of them and the passing score calculated for the exam (Reckase and Chen 2012). Figure 2 shows the standard setters’ distribution with an alphabetical code for each of them. The black line is the identified pass mark for the test.
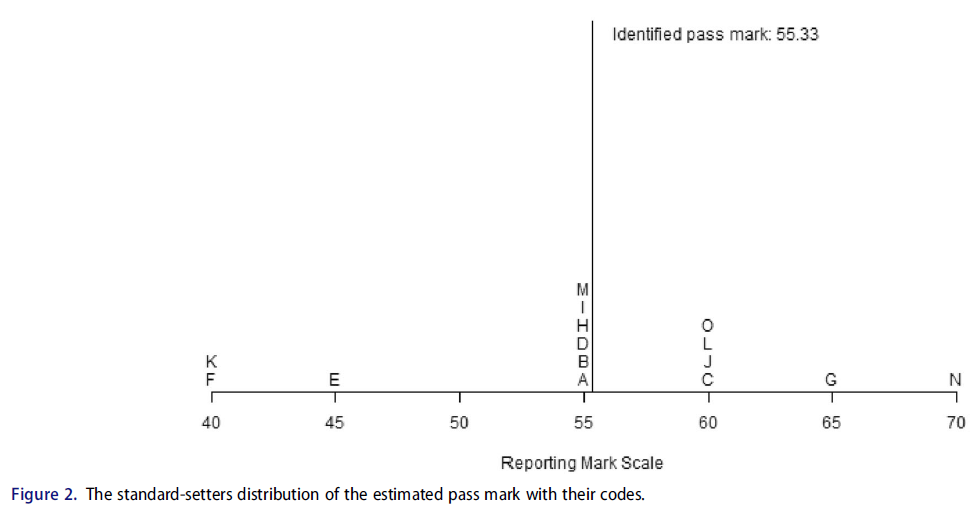
그림 2는 표준 설정자의 개별 표준 추정치와 모든 표준 설정자에 기초한 평균 추정치의 위치를 사용하여 피드백의 예를 보여준다. 수평선은 시험의 보고 마크 척도를 나타낸다. 줄의 각 문자는 한 평의 합격선 설정자의 판단에 따른 합격점(통과 점수) 위치를 나타낸다. 문자는 표준 설정자의 코드이므로 이 그림은 합격 점수를 결정하는 데 관여한 모든 표준 설정자에게 기밀로 표시될 수 있습니다. 표준 설정자는 코드를 부여받으므로 나머지 표준 설정자와 관련하여 추정된 표준을 알 수 있습니다. 예를 들어, 합격선 결정자 N은 보고기준 척도에서 70점으로 합격점을 추정하였다. 표준 설정자는 제공된 등급이 다른 표준 설정자의 등급보다 높은 추정 합격점을 초래했다는 것을 깨달을 수 있다.
Figure 2 illustrates this example of feedback with the locations of standard setters’ individual estimates of the standards and the average estimate based on all of the standard setters. The horizontal line represents the reporting mark scale for the test. Each of the letters on the line represents the standard (pass mark) location and results from the judgment of a single standard setter. The letters are the standard setters’ codes, so this plot can be confidentially presented to all the standard setters who have been involved in determining the passing score. The standard setters are given their code, so they know their estimated standard in relation to the rest of the standard setters. For example, standard-setter N gave ratings that resulted in an estimated standard at 70 on the reporting mark scale. The standard-setter can realise that the provided ratings resulted in an estimated pass mark above that of other standard setters.
이 피드백 방법은 평가 제공자에게 간단하며 쉽습니다. 이 때문에 본 가이드의 목적을 위해 표준 설정자에게 피드백을 제공하는 온라인 대화형 시스템을 설계했습니다. 이 시스템을 사용하면 표준 설정자가 모든 문항의 평균 추정을 조작manipulate하여, 축 상에서 새로운 통과 점수를 가지고 각 표준 설정자의 위치를 볼 수 있다.
This feedback method is straightforward and easy for assessment providers. Because of this, and for the purpose of this Guide, we have designed an online interactive system that provides feedback to standard setters. Using this system allows the standard setters to manipulate the average estimation of all questions to see each standard setter's location along with the new passing score on the scale axis. The online interactive feedback can be found at https://mt17.shinyapps.io/feed/.
경험적 항목 난이도에서 Angoff 등급의 편차
Deviation of Angoff ratings from empirical item difficulties
항목에 대한 실제 난이도(통계 가설 검정과 관련된 p-값과 혼동하지 않아야 함)로부터의 [Angoff 등급]의 편차는 '항목 추정 정확도item estimate accuracy'의 문제이다. [편차가 작을수록] 항목 추정 정확도의 타당성validity이 커집니다(Brandon 2004). [질문에 올바르게 답한 학생의 비율(즉, p-값)]은 표준 설정자에게 '현실 피드백reality feedback'으로 피드백된다. 이를 통해 표준 설정자는 평가 문항의 난이도를 더 잘 이해할 수 있다. 표준 설정자 문헌은 경계선에 대한 실제 p-값과 p-값을 개별 표준 설정자 등급과 비교하여 피드백을 제공한다는 것을 보여줍니다. 그러나 경계선 그룹에 대한 명확한 경험적 정의가 없다는 것을 기억하십시오. 경계선 그룹이 임의로 정의되더라도(예: 합격 표시 ± SEM) 소수의 경계선 학생만 합격점에 근접한 점수를 받을 수 있습니다. 따라서 합격점 위 또는 아래로 샘플이 편향되어 발생하지 않도록 경계 그룹을 정의해야 합니다. 표본에 대한 해석을 신뢰하기 위해 경계선 그룹의 평균 표시를 설정된 통과 표시와 비교합니다. 합격 표시에 가장 가까운 평균 점수는 경계선 그룹 p-값에 대해 덜 편향된 표본을 생성합니다. 표준 설정자의 일관성은 '표준 설정 등급이 항목의 상대적 난이도와 일치해야 한다'(Reid 1991)는 Reid(1991)가 제안한 경계선 그룹에 대한 p-값 또는 전체 학생 그룹에 대한 p-값과 비교하여 평가할 수 있다.
The deviation of Angoff ratings from actual difficulty levels (sometimes referred to as p-values, not to be confused with the p-values related to statistical hypothesis testing) for the items is a matter of 'item estimate accuracy’. The smaller the deviation, the greater the validity of the item estimate accuracy (Brandon 2004). The proportion of students who correctly answered the question (i.e. p-values) are fed back to standard setters as ‘reality feedback.’ This helps standard-setters get a greater understanding of the level of difficulty of assessment questions. The standard-setter literature shows both actual p-values and p-values for the borderline group are compared to individual standard-setter ratings to provide feedback. However, recall that there is no clear empirical definition of the borderline group. Even if the borderline group is defined arbitrarily (e.g. pass mark ± SEM), only a small number of borderline students may receive a mark around the pass mark. Therefore, the borderline group should be defined so as not to lead to a biased sample either above the pass mark or below the pass mark. To be confident of interpretations for the sample, the average mark of the borderline group is compared with the established passing mark. The average score closest to the pass mark produces a less biased sample of the borderline group p-values. Standard-setters’ consistency can be evaluated by comparing their ratings to the p-values for the borderline group or the p-values for the entire student group as suggested by Reid (1991), where ‘Standard setting ratings should be consistent with the relative difficulties of items’ (Reid 1991).
표준 설정자의 등급과 기준 그룹(경계선 학생 또는 전체 학생 그룹)에 대한 실제 항목 난이도의 차이를 측정하는 다양한 방법이 있으며, 이는 다음과 같다.
There are different methods to measure the differences between standard setters’ ratings and the actual item difficulty for the reference group (the borderline students or the entire student group), which are demonstrated below.
그룹 막대 차트
Group bar charts
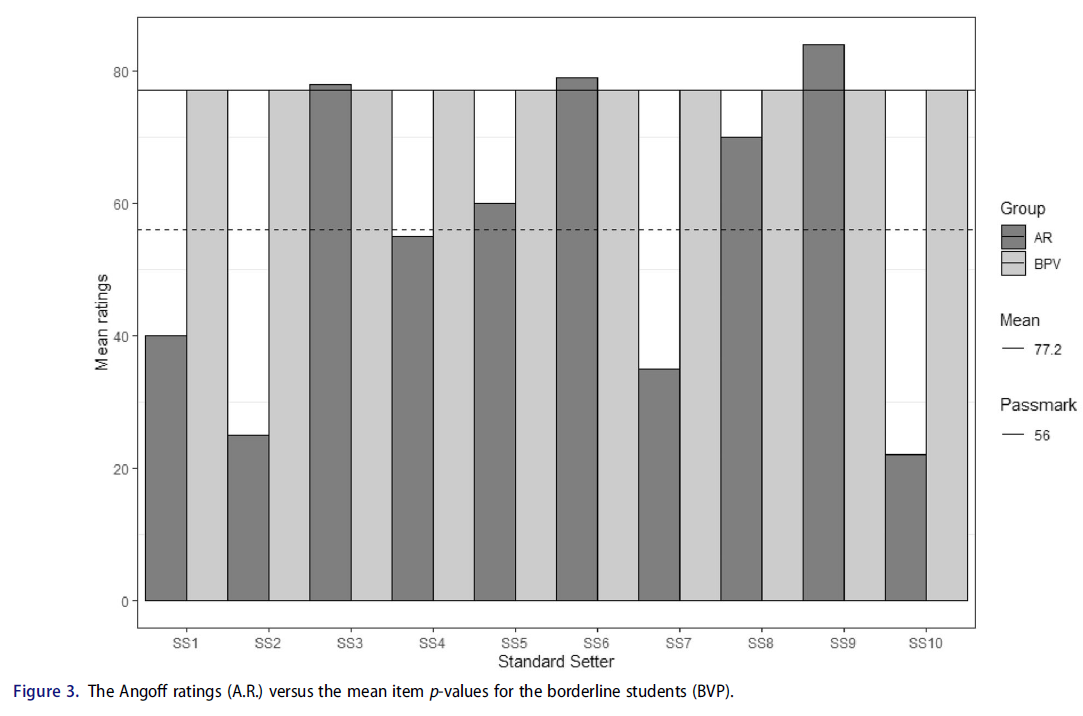
그룹 막대 차트는 [항목 난이도에 대한 표준 설정자의 등급(예: Angoff 등급)]과 [경계선 학생의 실제 평균 항목 난이도]를 비교하기 위해 생성됩니다. 그림 3은 각 표준 세터에 대한 평균 앙고프 등급(A.R.)을 보여줍니다. 실선은 경계선 그룹의 평균 p-값을 나타내고, 점선은 설정된 통과 표시를 나타내며, 실선은 경계선 학생의 평균 표시를 나타냅니다. 이 차트를 보면 표준 설정자(N = 10)는 합격 표시와 경계선 학생의 실제 평균 항목 난이도 간의 뚜렷한 차이를 관찰합니다. 또한, 각 표준 설정자는 자신의 합격 점수를 다음과 비교할 수 있다.
- 다른 표준 설정자(S.S.)
- 결정된 합격점(Passmark),
- [경계선 학생(BPV)의 평균 문제 난이도]와
Group bar charts are created to compare the standard setters’ ratings of item difficulty (e.g. Angoff ratings) and the actual mean item difficulty for borderline students. Figure 3 shows the mean Angoff ratings (A.R.) for each standard setter. The solid line represents the mean p-values for the borderline group, the dashed line represents the established pass mark, and the solid line represents the mean mark of borderline students. By looking at this chart, the standard setters (N = 10) observe a distinct difference between the pass mark and the actual mean item difficulty for borderline students. In addition, each standard-setter can compare their passing score
- with other standard setters (S.S.),
- with the established pass mark (Passmark) and
- with the mean difficulty of questions for borderline students (BPV).
이 그룹 막대 차트를 추가로 분석한 결과, [경계선 학생의 평균 점수(평균)]가 [표준 설정자가 설정한 합격점수]보다 높음을 알 수 있어 경계선 학생의 성적을 과소평가했음을 시사한다. 따라서 경계선 학생이 진정한 경계선 학생을 정확하게 반영하지 못하여 표본편향이 발생한다.
Further analysis of this group bar chart suggests the mean mark (Mean) of the borderline students is higher than the pass mark set by the standard setters, suggesting an underestimation of the performance of borderline students. Therefore, the borderline students do not accurately reflect the true borderline students, and thus, sampling bias occurs.
개별 항목에 대한 그룹 막대 차트
Group bar charts for individual items
표준 설정자는 각 항목과 경계선 그룹에 대한 [문항별 p-값]을 기준으로 등급에 대한 피드백을 받을 수도 있습니다. 이 피드백은 '표준 설정자가 개별 항목에 대한 경계 그룹 능력을 얼마나 정확하게 추정할 수 있었는가?'라는 질문을 명확히 한다. 개별 항목과 Angoff 등급을 기반으로 하는 막대 그래프는 표준 설정자 내 일관성에 유용한 정보를 제공할 수 있습니다. 표준 설정자는 경계선 학생들의 성과와 일치하는 방식으로 문제를 평가해야 한다. Angoff 등급과 개별 항목 p-값 간의 차이가 작을수록 표준 세터의 내부 일관성 수준이 높아집니다.
Standard setters can also be given feedback on their ratings based on each item and the associated item p-value for the borderline group. This feedback clarifies the question, ‘How accurately could the standard setters estimate the borderline group ability for individual items?’. Bar plots based on the individual items and the Angoff ratings could provide useful information for intrastandard setter consistency. A standard-setter is expected to rate questions in a way that is consistent with the performance of the borderline students. The smaller the difference between the Angoff ratings and individual item p-values, the higher the level of internal consistency of the standard setter.
그림 4는 개별 앙고프 등급과 경계선 학생의 개별 항목 p-값과의 연관성을 나타낸다. 이 안내서의 목적을 위해 네 가지 항목을 시연합니다. 그림 4는 표준 설정자 1이 여러 문항에 걸쳐 등급이 일관되지 않음을 보여주며, 경계선 그룹에 어려운 문항에서는 쉬운 문항으로 평가되며, 쉬운 문항에서는 높은 등급을 부여하여 표준 설정자 내 불일치를 나타낸다.
Figure 4 represents the individual Angoff rating and their association with individual item p-values for the borderline students. For the purpose of this Guide, four items are demonstrated. Figure 4 demonstrates standard-setter 1 is not consistent in ratings across questions, where the question was difficult for the borderline group, it is rated as easy, and where the question is easy, it rates hard, indicating intrastandard setter inconsistency.

항목 p-값에 대한 등급의 상관 관계
Correlation of ratings to item p-values
표준 설정자가 자신의 판단을 반영할 수 있는 또 다른 방법은 [개별 항목 수준 등급]과 [p-값] 간의 상관관계이다. 이는 표준 설정자에게 '평가자 판단과 관찰된 항목 난이도 값의 순위 순서ranking order관점에서 등급을 비교한 정도'를 전달한다. 이 피드백 정보를 통해 표준 설정자는 등급과 p-값 사이의 연결을 연결할 수 있다(버켄다히와 데이비스-베커 2012).
Another method that allows standard-setters to reflect on their judgments is the correlation between individual item level ratings and p-values. This communicates to standard setters ‘the extent to which their ratings were compared in terms of rank ordering of their judgments and observed item difficulty values’. This feedback information allows standard setters to link connections between ratings and p-values (Buckendahi and Davis-Becker 2012).
표준 설정 문헌에서는 (전체 학생에 대한) [개별 표준 설정자의 등급]과 [경험적 p-값] 사이의 상관관계와 경계선 학생에 대한 [개별 표준 설정자의 등급]과 [경험적 p-값] 사이의 상관관계에 대해 논의하고 있다[(예: (Brandon 2004). 그러나 Angoff가 권고한 대로 (전체 학생에 대한) [개별 표준 설정자의 등급]을 [경험적 p-값]과 비교하는 것은 결과의 잘못된 값으로 이어질 수 있다. 그는 [표준 설정자의 등급]과 [합격점에 가까운 점수를 받은 학생들] 사이의 관계를 조사할 것을 제안했다(Smith와 Smith 1988). 이 경우에, [개별 평가자의 (난이도) 추정치]와 [관찰된 항목들의 난이도] 사이의 상관관계가 낮다면 표준 설정자들의 등급에 대한 타당성 우려를 야기한다(Brandon 2004). 그러나 이는 시험 내용 타당성이나 추정치의 정확성의 문제가 아니다. 시험 합격점을 계산하는 데 사용되는 프로세스의 타당성의 문제이다(Smith and Smith 1988). 그러나 강한 상관관계를 달성한다고 해서 강력한 합격 점수가 설정되는 것은 아니다. 경계선 학생에 관해서 [등급]과 [p-값] 사이의 강한 상관관계는 [기준 참조criterion-referenced 접근법]에서 [표준norm-referenced 참조 접근법]으로 이동하는 표준 설정자와 함께 질문 평가 과정의 결함을 의미할 수 있다(Linn et al. 1991). Linn과 동료들은 높은 상관관계에 대한 가능한 이유를 다음과 같이 전달한다.
In the standard-setting literature, there is a discussion of both the correlation between the individual standard setters’ ratings and the empirical p-values and the correlation between the individual standard setters’ ratings and the empirical p-values for the borderline students [(e.g. (Brandon 2004)]. However, as Angoff recommended, comparing the individual standard-setters’ ratings with the empirical p-values may lead to a misleading value of the results. He suggested the relationship between standard setters’ ratings and students with a total mark close to the passing mark be examined (Smith and Smith 1988). As such, the low correlation between the individual judges’ estimates and the observed difficulty of the items raises validity concerns regarding the standard setters' ratings (Brandon 2004). However, it is not a matter of the test content validity or the accuracy of estimates; it is an issue of the validity of the process used to calculate that test’s pass mark (Smith and Smith 1988). However, achieving a strong correlation does not ensure that a robust passing score is established. A strong correlation between ratings and p-values for borderline students may imply a flaw in the question rating process with standard setters moving from the criterion-referenced approach to the norm-referenced approach (Linn et al. 1991). Linn and colleagues communicate possible reasons for a high correlation:
- 평가자들이 학생들을 위한 [문항의 난이도]에 민감하다는 것은 분명해 보인다. 그러나 이러한 민감도가
- 문항 p-값과 문항 검정 회귀에 대한 인식 때문인지,
- 평가자의 난이도에 대한 비공식적이고 암묵적인 이해 때문인지,
- 항목에 대한 주관적인 판단 때문인지는 알 수 없다.
- 'It seems clear that judges are sensitive to the difficulty of items for students. It is unknown, however, whether this sensitivity is due
- to their awareness of the item p-values and item test regressions,
- to the raters' informal and implicit understanding of difficulty, or
- to subjective judgments of the items'.
관심 있는 독자는 표준 설정 프로세스를 다른 곳에 알리기 위해 표준 데이터(영향 데이터) 피드백 공유와 관련된 추가 정보를 제공할 수 있다(Recase and Chen 2012; Tavakol and Dennick 2017).
Interested readers can find further information about providing additional information related to sharing normative data (impact data) feedback to inform the standard-setting process elsewhere (Reckase and Chen 2012; Tavakol and Dennick 2017).
조건부 p-값 피드백
Conditional p-value feedback
앞서 언급한 바와 같이, [전체 학생 그룹에 대한 p-값]과 [표준 설정자가 제시한 등급] 사이의 상관관계는 해당 시험의 합격점을 계산하는 데 사용되는 과정에 대한 잘못된 피드백을 제공할 수 있다. 마찬가지로 [합격점에 가까운 점수를 받은 소수의 경계선 학생]은 [경계선 학생의 성과에 대한 표준 설정자의 진정한 판단true jedgement]에 대한 편향된 판단biased rating을 유발할 수 있다. Rasch 모델과 같은 문항 반응 이론(IRT) 모델은 합격 표시에 가까운 경계선 학생을 선택하는 데 수반되는 문제를 완화한다. 래쉬 모델은 학생이 [학생의 능력에 따라 질문에 정확하게 답할 수 있는 조건부 확률]을 보여줍니다. 래쉬 모델에서 앙고프 등급은 개념화된다. 관심 있는 독자들은 AMEE Guide No. 72(Tavakol and Dennick 2012)에서 래쉬 모델에 대한 추가 정보를 찾을 수 있다.
As previously stated, the correlation between p-values for entire groups of students and the ratings rendered by the standard setters may provide misleading feedback of the process used to calculate that test’s pass mark. Similarly, a small number of borderline students who scored close to the passing mark may produce a biased rating of the standard setters’ true judgment of the borderline students’ performance. Item response theory (IRT) models, e.g. the Rasch model, mitigate the issues attached to selecting the borderline students close to the pass mark. The Rasch model shows us the conditional probability that a student will answer a question correctly based on the student’s ability. Under the Rasch model, Angoff ratings are conceptualised. Interested readers can find further information about the Rasch model in AMEE Guide No. 72 (Tavakol and Dennick 2012).
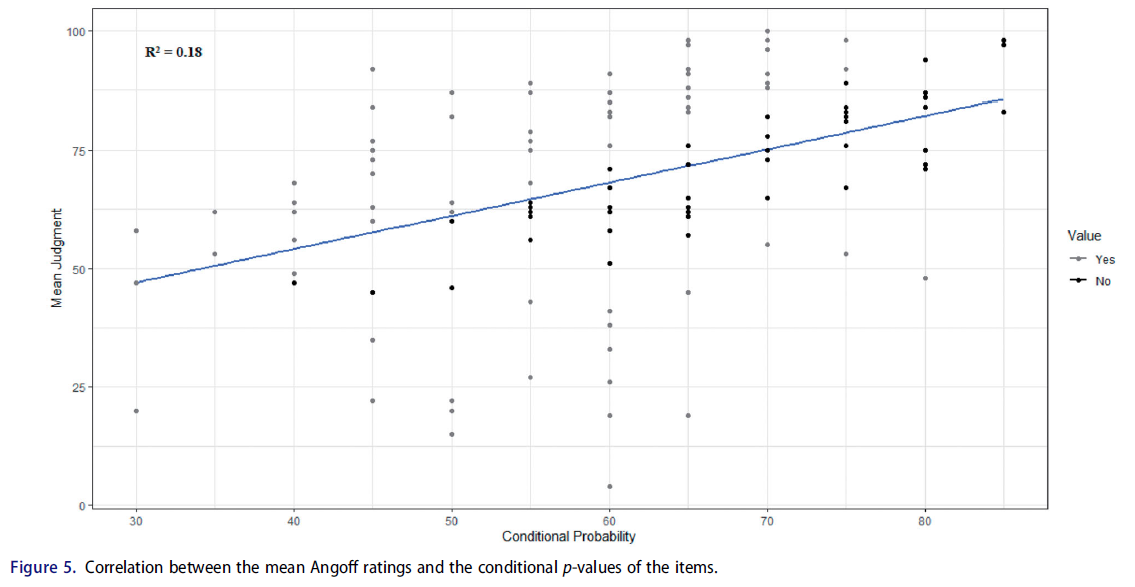
[라쉬 모형]에서 [문항 반응 조건부 p-값]은 [Angoff 등급] 및 [p-값]을 사용하여 계산됩니다. 경험적 조건부 p-값과 평균 등급 사이의 관계는 산점도 및 상관 계수를 사용하여 조사됩니다. 또한 선형 회귀선과 관련 결정 계수가 다루어진다. 이 모형에서 결정 계수(R2)는 평균 Angoff 등급과 조건부 p-값이 [공유하는 분산의 백분율]로 해석됩니다. 일반적으로 R2가 높을수록 평균 Angoff 등급이 조건부 p-값을 더 잘 예측합니다. 즉, 판단judgment과 조건부 p-값 사이에 작은 차이가 있습니다.
- '이 correspondence은 앙고프 절차의 일환으로 내려진 판단을 평가하는 중요한 근거로 받아들여졌다.'(Clauser et al. 2009).
The Rasch model item response conditional p-values are calculated using the Angoff ratings and p-values. The relationship between empirical conditional p-values and the average ratings are examined using scatterplots and correlation coefficients. In addition, a linear regression line and the associated coefficient of determination are addressed. In this model, the coefficient of determination (R2) is interpreted as the percentage of variance shared by the mean Angoff ratings and the conditional p-values. In general, the higher the R2, the better the mean Angoff ratings predict the conditional p-values. Put another way, there are small disparities between the judgments and the conditional p-values.
- ‘This correspondence has been accepted as an important basis for evaluating judgments made as part of the Angoff procedure’ (Clauser et al. 2009).
그림 5는 [평균 Angoff 등급]과 [조건부 p-값] 사이의 관계를 나타내는 산점도입니다. 보시다시피 평균 Angoff 등급과 조건부 p-값 사이에 0.42의 상관 관계가 얻어집니다. 따라서 R2는 0.18입니다. 즉, 평균 Angoff 등급의 변동은 조건부 p-값의 변동으로 설명됩니다. 또한, 판단과 조건부 p-값 간의 차이를 식별하여 검토할 영역을 식별할 수 있다. 판단과 조건부 p-값 간의 차이가 20% 이상이면(이 컷오프 값은 임의적이고 판단적이며 변경될 수 있음), 데이터 점은 산점도에 다른 색으로 표시됩니다. 그림 5에서 산점도의 회색 점으로 표시되어 있다.
Figure 5 shows a scatterplot indicating the relationship between the mean Angoff ratings with the conditional p-values. As you can see, a correlation of 0.42 is obtained between the mean Angoff ratings and the conditional p-values. Therefore, R2 is 0.18, i.e. 18% of the mean Angoff ratings’ variation is explained by the variation in the conditional p-values. Further, the difference between judgments and conditional p-values can be discerned to identify areas for review. If the difference between judgments and the conditional p-values is more than 20% (this cut-off value is arbitrary and judgmental and can be changed), the data points are marked with a different colour on the scatterplot. In Figure 5, they are shown in grey dots on the scatterplot.
패스마크의 신뢰성 및 신뢰성
Reliability and dependability of pass marks
[일반화 가능성(G) 이론의 결과]는 항목과 표준 세터에 걸친 통과 표시와 관련된 오류의 근원을 최소화하기 위해 표준 세터에 피드백될 수 있다. 특정 테스트의 합격 표시는 표준 세터 및 항목에서 관측된 평균입니다. 평균은 표준 세터 모집단과 항목 세계(Brennan and Lockwood 1980)에 대한 평균으로 정의된 통과 표시의 추정치이다. G 이론은 다른 곳에서 설명되며, 독자들은 더 많은 정보를 위해 다음을 참조할 수 있다. 타바콜과 데닉 2012, 타바콜과 브레넌 2013.
The results of generalisability (G) theory can be fed back to standard setters to minimise sources of error associated with the pass mark across items and standard setters. The pass mark in a particular test is the observed mean across standard setters and items. The mean is an estimate of a passing mark defined as the mean for a population of standard setters and a universe of items (Brennan and Lockwood 1980). G-theory is described elsewhere, and readers may refer to the following for more information: Tavakol and Dennick 2012; Tavakol and Brennan 2013.
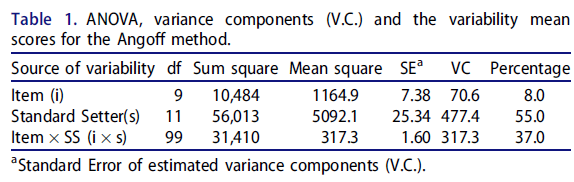
G 이론에서 분산 성분(V.C.)은 각 면facet에 부착된 오차를 측정하기 위해 계산된다. 이들은 G 연구에서 분석의 기본 단위이며 분산 분석(ANOVA)을 사용하여 추정됩니다. V.C.는 각 오류 원인과 관련된 분산을 알려줍니다. 표준 설정자가 경계선 그룹의 성능을 독립적으로 평가할 때(즉, 모든 표준 설정자가 모든 항목을 평가한다), 항목이 표준 설정자와 교차되는 설계에 대해 V.C.가 계산되므로 이 설계는 i × s(단일 면 설계)로 표시된다. 이 설계에 따르면 항목 V.C., 표준 세터 V.C. 및 표준 세터 V.C.에 의한 항목의 교호작용 등 세 가지 V.C.를 추정할 수 있습니다.
- 항목 V.C.는 항목에 대한 평균 등급의 변동성을 나타냅니다.
- 항목 표준 설정자 V.C.는 표준 설정자에 대한 평균 등급의 변동성을 보여줍니다.
- 표준 설정자와 문항 사이 상호작용의 V.C.는 [설계와 무관한 체계적 오류(기타 측면)]를 보여준다.
In G-theory, variance components (V.C.s) are calculated to measure the error attached to each facet (in the language of G theory, e.g. standard setters and items). They are the basic unit of analysis in a G study and are estimated using analysis of variance (ANOVA). The V.C.s tell us the variance associated with each source of error. When standard-setters independently rate the borderline group's performance (i.e. all standard setters rate all items), V.C.s are calculated for a design in which items are crossed with standard setters, and hence this design is denoted i × s (a single facet design). According to this design, three V.C.s can be estimated, the item V.C., the standard setters V.C., and the interaction of item by the standard setters V.C.
- Item V.C. shows the variability in mean ratings over items.
- Item standard-setters V.C. shows the variability in mean ratings across standard setters.
- The V.C. of the interaction of items by standard setters shows systematic error (other facets) unrelated to the design.
표 1은 R 코드를 사용하여 생성된 표준 세터와 교차되는 10개 항목의 분산 분석(ANOVA) 및 분산 성분을 보여줍니다. 표 1에서 볼 수 있듯이
- 문항에 따른 평균 Angoff 등급(표준 세터당 합격 표시)의 변동성은 작다. 등급항목의 난이도가 변동된 정도를 실제 항목 난이도의 변동으로 설명한다는 점에 유의하여, 항목 변동item variance은 오류의 원인으로 간주하지 않는다(Clauser et al. 2014).
- 가장 큰 오차 분산은 표준 세터에 기인하며, 이는 [표준 설정자에 걸친 평균 등급의 변동성이 높다]는 것을 시사합니다. 이것은 우리가 표준 설정자를 바꿔서 절차를 반복한다면 결과가 달라질 것이라는 것을 시사한다.
- 여기서, 표준 설정자가 표준 설정자의 목표 인구와 항목의 세계로 일반화될 때 전체 [체계적 오류(37%)]를 간과해서는 안 된다.
Table 1 shows the analysis of variance (ANOVA) and the variance components of 10 items that are crossed with standard setters, generated using R codes. As we can see from Table 1,
- there is a small variability in the mean Angoff ratings (the passing mark per standard setter) across items. Noting that the extent to which the variation in the difficulty of the rated items is explained by the variation in the actual item difficulty, item variance is not considered as a source of error (Clauser et al. 2014).
- The largest error variance is attributed to the standard setters, suggesting high variability in the mean ratings across standard setters. This suggests the results would be different if we repeat the procedure with different standard setters.
- Here, the overall systematic error (37%) should not be overlooked when the standard setters are generalised to standard setters’ target population and items’ universe.
표준 설정 방법이 [다른 동등한 표준 설정자]에 대해서 [다른 결과]를 초래하는 경우, 방법의 신뢰성과 신뢰성에 의문이 제기됩니다. 신뢰도는 주관적 판단에 따라 결정된 합격점수의 일관성을 말한다. 이 과정은 '표준 설정 프로세스의 외부external'에 존재하며, 합격 점수가 확립된 후에만 평가할 수 있다(Berk 1986). 추정된 V.C.는 표준 세터당 통과 마크의 신뢰성을 나타내는 G 계수를 추정하는 데에도 사용된다.
If a standard-setting method results in different results from other equivalent standard setters, the method's dependability and reliability are questioned. Reliability refers to the consistency of the passing score decided on the basis of subjective judgments. It is ‘external to the standard-setting process’ and can only be assessed after the pass mark has been established (Berk 1986). The estimated V.C.s also are used to estimate a G coefficient indicating the reliability of the passing marks per standard setters.
그림 6은 통과 마크의 잠재적 개선을 위한 추정 알파 및 파이 계수를 나타낸다.
- i × s 설계에서 [알파 계수]는 상대 오차 분산을 포함하는 [크론바흐의 알파]와 동일합니다.
- [파이 계수]는 절대 오차 분산을 포함하며, '신뢰성 지수'(Brennan 2010) 또는 [표준 설정자 간 일관성]이다.
Figure 6 presents estimated alpha and phi coefficients for potential improvement of the pass mark.
- The alpha coefficient for an i × s design is equivalent to Cronbach's alpha involving relative error variance.
- The phi coefficient involves absolute error variance, and it is ‘an index of dependability’ (Brennan 2010) or interstandard setter consistency.
여기서 12개의 합격선 설정자에 대한 신뢰도 지수는 고무적이지 않습니다(phi = 0.52). 낮은 신뢰도 지수 값은 통과 마크가 다른 표준 설정자에게 일반화될 수 없음을 시사하며, 따라서 Angoff 등급은 수정이 필요하다. 그림 6은 또한 표준 세터의 수가 증가함에 따라 신뢰도 지수가 증가하는 것을 보여준다.
Here, the index of dependability for 12 standard setters is not encouraging (phi = 0.52). The index value suggests the pass mark is not generalisable to other standard setters, and hence the Angoff ratings need revision. Figure 6 also shows as the number of standard setters increases, the index of dependability increases.

평가 정확도 향상을 위한 심사관 피드백
Feedback for examiners to improve rating accuracy
OSCE 및 승인 OSCE
OSCEs and admission OSCEs
이전 섹션에서는 학생 수행의 기준 또는 기준 수준에 대한 몇 가지 피드백 방법에 대해 논의했습니다. 표준은 학생점수의 분포를 [합격생]과 [불합격생]이라는 상호 배타적인 두 그룹으로 나눈다. 각 표준 설정자의 합격 표시와 시험에 대해 설정된 합격 표시를 비교한 요약은 시험 결과를 조정하는 데 중요한 역할을 하지만, 합격 표시를 결정하는 데 도움을 주지 않은 사람들과도 공유할 수 있다. 이는 표준성과standard performance는 정책 결정의 문제이며, 평가 제공자는 합격점수가 얼마나 높은지 낮은지를 결정하기 때문이다. 그 결정은 경계선 [학생의 성격, 평가의 성격, 학생 훈련 수준, 그리고 실무자에 대한 지역사회의 필요성] 등 몇 가지 요소를 기반으로 한다. 그럼에도 불구하고 평가 제공자는 표준 성과 결정을 정당화하기 위해 합리적이고 신뢰할 수 있는 합격점을 제공해야 한다(Kane 등 1999).
In previous sections, we discussed some feedback methods for the standard or criterion level of student performance. The standard splits student marks’ distribution into two mutually exclusive groups: passing students and failing students. A summary from the comparison of each standard setters’ passing mark and the established passing mark for the test can be shared with those that play a crucial role in moderating the exam results but who did not help determine the passing mark. This is because the standard performance a matter of policy decision, and assessment providers decide with regards to how high and low is the passing score. The decision is based on several factors, such as
- the nature of the borderline student,
- the nature of assessment,
- student training level, and
- community need for practitioners.
Nevertheless, assessment providers need to provide a reasonable and credible pass mark to justify their standard performance decision (Kane et al. 1999).
[OSCE]에서 [학생 중심 접근법]은 특정 과제를 수행할 때 학생의 지식, 기술 및 판단을 식별하기 위해 학생 성과를 관찰할 때 [표준 설정자의 주관적 해석]이 적용되기 때문에 더 적절하다(Kane 등 1999; Kramer 등 2003). OSCE에서는 [보더라인 그룹법]과 [보더라인 회귀법]을 모두 사용하지만, [보더라인 회귀법(BRM)]이 [중위수 보더라인]보다 더 많이 사용되는 것으로 보인다. 각 OSCE 스테이션 내에서 과제에 대한 학생의 성과는 평가되는 각 항목 또는 영역에 점수를 매겨 학생에게 총 점수를 생성한다. 표준 설정 또는 심리측정학 연구의 목적을 위해, 심사관은 [할당된 점수]와는 독립적으로 [글로벌 평가 척도]를 사용하여 학생 수행의 질에 대한 전반적인 주관적 해석을 평가한다.
In OSCEs, the student-centred approach is more appropriate as the subjective interpretation of standard setters is applied when observing student performance to identify students’ knowledge, skills, and judgments when a specific task is performed (Kane et al. 1999; Kramer et al. 2003). Both the borderline group method and the borderline regression methods are used in OSCEs, but it seems that the borderline regression method (BRM) is more popular than the median borderline. Within each OSCE station, the student’s performance on the task is rated by examiners who assign a mark to each of the items or domains being assessed, generating a total mark for the student. For standard-setting or psychometric study purposes, examiners rate an overall subjective interpretation of student performance’s quality using a global rating scale independent of the marks assigned.
일부 연구는 학생 수행 등급의 일반적인 오류에 대한 우려를 다룬다(Godfrey et al. 2015; Yeates et al. 2015; Fuller et al. 2017; Tavakol and Pinner 2018). 학생을 특정 범주(예: 실패, 경계선 실패, 경계선 통과, 양호 및 우수)에 올바르게 배치하는 것은 등급 정확도를 제안하고 평가 제공자에게 유용한 피드백 정보를 제공한다(Roch et al. 2012). 다음 섹션에서는 심사관에게 피드백 정보를 제공하기 위해 OSCE에서 심사관의 일부 오류를 시연한다.
Some studies address concerns about common errors in student performance ratings (Godfrey et al. 2015; Yeates et al. 2015; Fuller et al. 2017; Tavakol and Pinner 2018). Placing students correctly into a specific category (e.g. fail, borderline fail, borderline pass, good and excellent) suggests rating accuracy and provides useful feedback information for assessment providers (Roch et al. 2012). In the following sections, we demonstrate some of the examiners’ errors in OSCEs in order to provide feedback information for examiners.
체크리스트 등급과 글로벌 등급 간의 불일치
Discrepancy between checklist ratings and global ratings
체크리스트의 도메인 수준(항목 수준) 등급과 전체 글로벌 척도 등급은 학생의 성과와 동일한 정보를 표시해야 합니다. 항목 등급이 높은 경우 전체 글로벌 척도 등급도 높아야 합니다. 검사자 체크리스트 점수와 글로벌 등급 간의 불일치는 경계선에 있는 학생들에게 영향을 줄 수 있고 측정에 구성 무관한 분산을 추가할 수 있기 때문에 이 대응은 필수적이다.
The domain-level (item level) ratings from the checklist and overall global scale ratings should indicate the same information the student’s performance. If item ratings are high, overall global scale rating should also be high. This correspondence is essential as the discrepancy between examiner checklist scores and the global ratings may affect the borderline students and add construct-irrelevant variance to measurement.
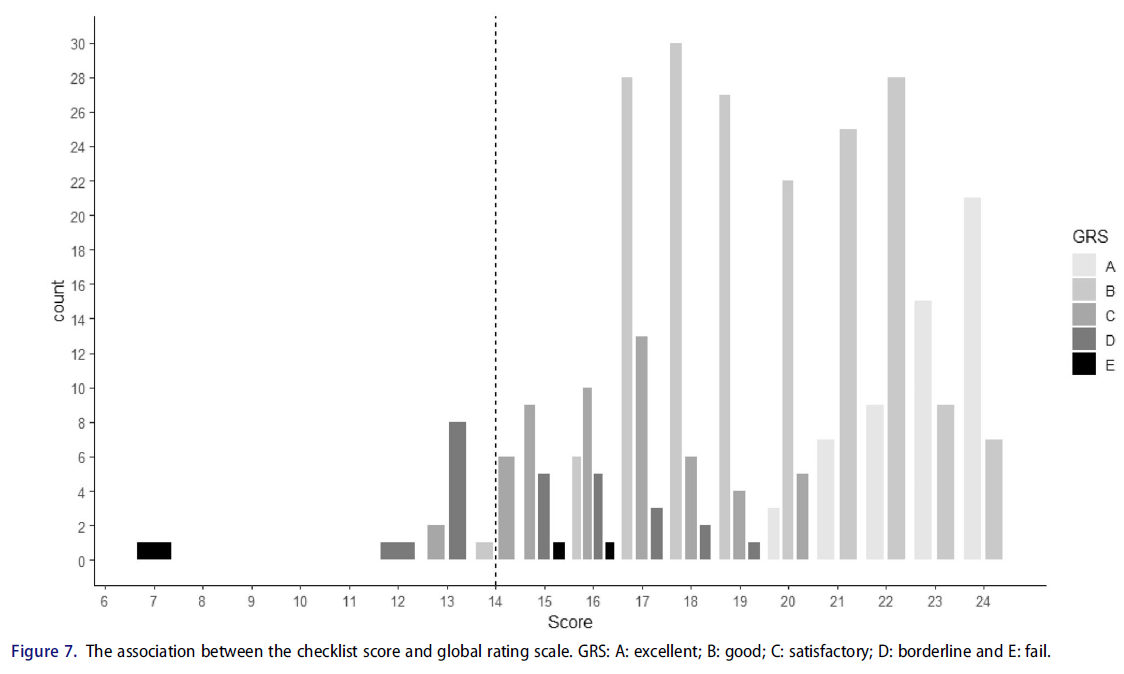
그림 7은 체크리스트 점수와 글로벌 등급 사이의 연관성을 보여준다. 점선은 관심 스테이션에 대한 통과 표시를 나타낸다. 그림에서 알 수 있듯이, 일부 학생들의 체크리스트 점수와 글로벌 등급 사이에는 일치하지 않아 검사자 정렬이 불량하다는 것을 보여준다. 도표를 살펴보면, 일부 학생들은 체크리스트를 기준으로 항목이나 수행 영역에서 좋은 점수를 받지만, 경계선 학생으로 분류된다. 가장 중요한 것은, 체크리스트 총점수가 합격점수보다 높은 몇몇 학생들은 불합격으로 분류된다는 것이다. 추가 검사를 통해 옵션 E(실패)가 거의 사용되지 않기 때문에 사용된 등급 척도 범주의 기능에 결함이 있음을 알 수 있습니다. 각 옵션(A~E)에 대해 최소 10개의 관측치가 필요합니다. 따라서 이는 대부분의 학생들이 이 역을 통과할 것으로 예상되지 않는다고 가정할 때 'E'가 신뢰할 수 없는 옵션임을 시사할 수 있다(Tavakol 및 Pinner 2019).
Figure 7 presents the association between the checklist scores and global ratings; the dashed lines represent the pass mark for the station of interest. As we can see from the Figure, there is no correspondence between the checklist scores and global ratings for some students, demonstrating poor examiner alignment. On inspecting the Figure, some students receive good scores on items or performance domains based on the checklist, but they are classified as borderline students. Most important, some students who receive checklist total scores greater than pass mark are categorised as fail students. A further inspection shows that the functioning of the rating scale category used is flawed because option E (Fail) is rarely used. At least ten observations are required for each option. Therefore, this may suggest ‘E’ is an implausible option (Tavakol and Pinner 2019) assuming most students are not expected to pass this station.
평가자가 성과 등급에 미치는 영향
Examiner effect on performance ratings
평가 및 측정 문헌에서는 평가자가 성과 등급에 미치는 영향에 많은 관심이 쏠리고 있다. 이론적으로 [세 가지 요소]가 등급 정확도에 영향을 미칠 수 있다.
- 학생 성과,
- 학생에 대한 시험관의 태도 또는 관찰,
- 의도된 성과에 대한 시험관의 관찰 회상
[고전적 검사 이론]은 각 구성 요소에 대한 성능 등급의 결과를 예측한다. 예를 들어, 학생 수행의 태도는 다음의 합이다
- 학생의 진정한 수행(오류 없는 평가),
- 수행의 태도 편향,
- 무작위 오류.
따라서 등급의 품질과 등급 효과를 평가하고 개선하고자 할 때 이러한 구성요소를 고려할 필요가 있습니다.
In the assessment and measurement literature, much attention has been paid to examiners’ effect on performance ratings. Theoretically, three components can influence the rating accuracy:
- student performance,
- attitudes or observation of the examiner towards the student,
- the recall of the examiner’s observation of the intended performance (Landy and Farr 1980).
Classical test theory predicts the outcome of the performance rating for each component. For example, the attitude of student performance is the sum of
- the student’s true performance (error-free rating),
- the bias of attitude of the performance, and
- random error.
Therefore, when we want to evaluate and improve the quality of ratings and the rater effect, these components need to be considered.
Cronbach(1990)는 평가자가 평가 과정에서 도입할 수 있는 가장 심각한 오류, 즉 '매파적'과 '비둘기적' 효과(Cronbach 1990)로 간주했다. 심사관이 척도에서 특정 위치를 선호하는 경향은 두 가지 부정적인 결과를 낳는다.
- 첫째, 이것은 의심스러운 학생 평점으로 이어진다. 실제로, 높은 등급 또는 낮은 등급은 평가된 학생의 실제 성적보다는 심사관의 태도를 반영할 수 있다(Miller et al. 2013).
- 둘째, 중심 경향 오차(예: 학생들을 평균으로 배치하는 경향이 있는 시험관)는 '척도의 중심에 등급 쏠림'를 초래한다. 따라서, 학생 평점의 범위는 감소합니다. 범위가 줄어들면 학생 등급ratings의 타당성과 신뢰성이 떨어진다.
Cronbach (1990) considered the rater effect as the most severe error that a rater can introduce in a rating process, i.e. the ‘hawkish’ and ‘dovish’ effect (Cronbach 1990). The tendency of an examiner to favour a specific position on the scale has two negative consequences.
- First, this leads to questionable student ratings. Indeed, a high or low rating may reflect the examiner’s attitude rather than the actual performance of the student rated (Miller et al. 2013).
- Second, the central tendency error (e.g. examiners who tend to place students at average) results in the ‘bunching of ratings in the centre of the scale’. Therefore, the range of student ratings decreases. Reducing this range leads to a decrease in the validity and reliability of student ratings.
[행동 관찰 정확도에 대한 검사자의 성과 평가 효과]의 중요성을 간과해서는 안 된다. 보다 구체적으로, 검사자 성과 측정의 주요 목적이 성능 등급 정확도 향상이라는 점을 감안할 때, 각 검사자마다 각 스테이션 내의 성과에 대한 피드백을 제공할 필요가 있다. 피드백을 제공하기 위한 몇 가지 접근법이 있다. 우리의 경험에 따르면, [검사자 오류]보다는 [등급 정확도 향상에 초점을 맞춘 간단한 방법(예: 상자 그림 또는 막대 그림)]을 사용하는 것이 검사자의 더 많은 관심을 받는다. 그림 8은 상자 그림을 사용한 검사자 수행의 한 예를 나타냅니다. 다른 예는 다른 곳에서 설명되었다(Tavakol 및 Pinner 2018).
The importance of the performance rating effect by examiners on behavioural observation accuracy should not be overlooked. More specifically, given that the primary purpose of measuring examiner performance is to improve performance rating accuracy, it is necessary to give each examiner feedback on their performance within each station. There are several approaches to providing feedback. Based on our experience, using simple methods (e.g. boxplots or bar plots) focusing on improving rating accuracy, rather than examiner errors, gets more attention from examiners. Figure 8 represents one example of examiner performances using box plots. Other examples have been described elsewhere (Tavakol and Pinner 2018).

그림 8은 가상 스테이션 내의 검사자 성능을 나타내며 각 스테이션에 대해 제공될 수 있다. 그림에서 알 수 있듯이, 8명의 검사관(검사관 코드 제공)이 특정 관측소(x축)에서 학생들을 평가했습니다. 각각의 스테이션 내에서 시험관들은 일관되게 점수를 매겼지만, 일부 시험관들은 다른 시험관들에 비해 학생들의 성적을 불규칙적으로 평가한 것으로 보인다. 그림을 검토하면 시험관 4에 의해 등급이 매겨진 학생들의 경우, 거의 모두가 이 스테이션에 대해 설정된 합격 점수(빨간색 점선)를 기준으로 해당 역에 불합격되었음을 알 수 있다. 이것은 '매파적'이거나 엄격한 심사관을 나타낼 수 있다. 그러나 심사관 4는 '비둘기파' 또는 관대한 심사관을 나타낸다. 시험관 7은 시험관 3보다 훨씬 더 엄격하다. 이는 평가 제공자가 학생들의 점수를 공정하게 하기 위해 이러한 시험관의 등급을 조정(중간)한다는 것을 나타낼 수 있다. 특히 상자 그림 구조를 그림과 함께 요약하면 검사자가 상자 그림을 더 쉽게 해석할 수 있습니다.
Figure 8 represents examiner performance within a hypothetical station and could be provided for each station. As we can see from the Figure, eight examiners (examiner codes are provided) rated students in a particular station (x-axis). Within this station, examiners rated consistently, yet some examiners seem to have irregularly rated student performance compared to other examiners. If we review the Figure, we can see that for the students rated by examiner four, almost all failed the station based on the passing score established for this station (the red dashed line). This may represent a ‘hawkish’ or stringent examiner. However, examiner 4 represents a ‘dovish’ or lenient examiner. Examiner 7 is even more stringent than examiner 3. This may indicate that assessment providers adjust (moderate) the ratings of these examiners in order to make the students’ marks fair. Of note, including a summary of the box plots’ structure with the Figure may make it easier for examiners to interpret the box plots.
성능 피드백을 위한 막대 차트
Bar chart for performance feedback
간단한 피드백 접근 방식은 막대 차트를 사용하여 검사자의 성과를 입증한다. 이 접근법에서 검사자는 [표준 점수] 또는 [z 점수]라는 통계를 사용하여 서로 비교됩니다. [z 점수]는 점수가 [특정 분포의 평균]에서 얼마나 많은 표준 편차만큼 떨어져 있는지를 나타낸다. 시험관의 점수를 z 점수로 환산하면, 우리는 그것들을 서로 비교하고 어떤 시험관이 모든 관측소에서 '비둘기' 또는 '매파'로 평가했는지 볼 수 있다. z 점수가 높을수록 다른 사람에 비해 극단적인 점수를 받는다. 따라서 0.5점이라는 평균에 가까운 z 점수는 평가자가 특별히 '비둘기파' 또는 '매파'가 아니었음을 나타냅니다.
- 표준 점수가 전체 분포에서 -2라고 가정합니다. 이 경우 이는 검사자가 평균보다 -2 표준 편차 낮은 점수를 주었음을 나타내며, 평균적인 검사자에 비해 가혹하거나 '매파적'일 가능성이 높습니다.
- 표준 점수가 2보다 크면 심사관이 관대하거나 '비둘기적'임을 나타냅니다.
A simple feedback approach employs bar charts to demonstrate examiner performance. In this approach, examiners are compared with each other using a statistic called a standard score or z score. The z score indicates how many standard deviations the score is from the mean of a particular distribution. If examiners’ scores are converted to z score, we can compare them with each other and see which examiner rated ‘dovish’ or ‘hawkish’ across all stations. The higher the z score, the more extreme the score relative to others. Therefore, a z score of 0.5, being close to the mean, indicates that the assessor was not particularly ‘dovish’ or ‘hawkish’.
- Suppose a standard score is −2 on the whole distribution. In that case, this indicates the examiner scored −2 standard deviations below the mean and is likely to be harsh or ‘hawkish’ compared to the average examiner.
- If a standard score is larger than 2 this shows the examiner is lenient or ‘dovish’.
2보다 크거나 -2보다 작은 표준 점수를 임계값으로 설정하는 것은 임의적인 접근법입니다. 다만, 점수가 정규 분포일 때 표준점수가 +3 이상 또는 -3 이하인 경우는 예외적이라는 점에 유의해야 한다. 우리가 시험관의 점수를 z 점수로 환산하면, 우리는 z 점수에 대한 막대 차트를 그릴 수 있다. 그림 9와 같이, 시험관 10의 점수는 -2 z 점수 아래에 나타나지만, +2 z 점수 위에는 나타난 평가자는 없다. 평균보다 두 표준 편차 높거나 낮은 점수를 임계값으로 사용하면 학생들의 점수에 '비둘기 또는 매' 효과가 거의 없을 수 있습니다. z 점수에 대한 자세한 내용은 다른 곳에서 참조할 수 있습니다(Tavakol 및 Pinner 2018).
Setting a standard score larger than 2 or less than −2 as the threshold is an arbitrary approach. However, it should be noted, when the scores are normally distributed, it is exceptional to get a standard score greater than +3 or less than −3. When we convert the examiners’ scores to z scores, we can draw bar charts for the z scores. As shown in Figure 9, examiner 10’s scores appear below the −2 z score, but no scores appeared above the +2 z score. Using two standard deviations above or below the mean as the threshold may suggest little ‘dove or hawk’ effect on students’ scores. For more information on z scores, readers can refer elsewhere (Tavakol and Pinner 2018).

변수 지도
Variable map
MFRM(Many Facet Rasch Model)은 불규칙한 검사자를 탐지하는 고급 심리 측정 방법이다. 모델의 복잡성 때문에, 이러한 피드백에 대한 접근 방식은 라쉬 모델이 추가 설명을 위해 제공되지 않는 한, 특히 수학 교육을 받지 않은 시험관들에 의해 잘 소화되지 않을 수 있다. 라쉬 모델과 MFRM 접근법은 다른 곳에서 설명된다(Tavakol 및 Dennick 2012; Tavakol 및 Pinner 2019).
Many Facet Rasch Model (MFRM) is an advanced psychometric method to detect erratic examiners. Due to the model’s complexities, this approach to feedback may not be well digested by examiners, especially those who have not been schooled in math, unless the Rasch model is offered for further explanation. The Rasch model and the MFRM approach are described elsewhere (Tavakol and Dennick 2012; Tavakol and Pinner 2019).
그림 8은 세 가지 측면(학생, 스테이션 및 검사자)이 있는 가상의 OSCE 시험에 대한 변수 맵을 보여준다.
- 동일한 로짓 척도(첫 번째 열, 'Measr'라는 제목)를 기준으로 [학생들의 능력, 스테이션 난이도 및 심사관의 엄격도 측정치]를 제시하여 모든 측면을 공통 척도로 비교할 수 있다.
- 두 번째 열('학생')은 학생의 능력을 나타냅니다. 이 열에서 각 점은 한 학생을 나타내며, 두 명인 경우 학생은 별표(*)로 표시됩니다.
- 세 번째 열에는 스테이션 facet이 포함됩니다. 스테이션들은 위에서 가장 어려운 것부터 아래에서 가장 덜 어려운 것까지 분포되어 있다.
- 네 번째 열은 [검사자 facet(숫자로 암호화됨)]을 나타냅니다. 엄격한 심사관은 열의 맨 위에 배치되고 관대한 심사관은 열의 맨 아래에 배치됩니다.
- 다섯 번째 열은 '총 점수 달성'을 나타냅니다. 본 AMEE 가이드의 목적상, 우리는 검사자의 측면에만 초점을 맞추고 있습니다.
Figure 8 shows the variable map for a hypothetical OSCE exam with three facets (student, station and examiner).
- It presents the spread of students’ ability, station difficulties and examiner severity measures on the same logit scale (the first column, titled ‘Measr’), so all facets can be compared with each other on a common scale.
- The second column (titled ‘student’) presents student ability. In this column, each dot represents one student, with 2 students represented by an asterisk (*).
- The third column contains the station facet. The stations are distributed from most difficult at the top to the least difficult at the bottom.
- The fourth column shows the examiner facet (encrypted as numbers). Stringent examiners are located at the top of the column, and lenient examiners locate at the bottom of the column.
- The fifth column represents ‘total score achieved’. For the purpose of this AMEE Guide, we only focus on the examiner facet.
그림 10의 4열은 MFRM을 기반으로 한 검사자의 엄격성과 관용을 보여준다. 검사관은 상단의 엄격함부터 하단의 관대함 순으로 정렬되며, 변수 맵의 상단에는 '매파적' 검사관이 배치된다. 반대로 '비둘기' 검사자는 열의 지도 하단에 있습니다.
Figure 10, column 4, shows the examiner stringency and leniency based on the MFRM. Examiners are ordered in order from stringency at the top to leniency at the bottom, with ‘hawkish’ examiners are located at the top of the variable map. In contrast, ‘dovish’ examiners are located at the bottom of the map in the column.

그림 10에서 볼 수 있듯이 Examiner 엄격도 로짓은 -0.87 로짓에서 +1.60 로짓까지 산재해 있습니다. 검사자 10은 1.60 로짓의 측정값인 더 엄격한 것으로 변수 지도에 나타납니다. 그러나 시험관 12명을 제외하고 모두 비둘기파였던 다른 시험관들에 비해, 시험관 10명은 [이번 OSCE 시험]에서 -0.87의 로짓으로 가장 비둘기파 시험관이다. MFRM 접근 방식은 위에서 논의된 불규칙한 검사자의 유형(예: 후광 오류 및 중심 경향 오류)을 밝힐 수 있다는 점을 언급하는 것이 주목할 만하다.
As we can see from Figure 10, the Examiner severity logits are scattered, ranging from −0.87 logits to +1.60 logits. Examiner 10 appears on the variable map as more severe, a measure of 1.60 logits. However, compared to other examiners who have all been dovish except examiner 12, examiner 10 is the most dovish examiner, with −0.87 logits, in this OSCE exam. It is noteworthy to mention the MFRM approach can reveal the types of erratic examiners discussed above (e.g. halo error and central tendency error).
공정한 평균을 사용하여 피드백 제공
Providing feedback using fair averages
만약 우리가 두 명의 시험관, 한 명은 비둘기파이고 다른 한 명은 매파적인 시험관에게 평가받는 것을 학생들이 꺼리는 것은 의심의 여지가 없다. 그러나, 두 심사관 모두 불공정한 점수를 낼 수 있다. 학생들의 점수를 공평하게 하기 위해, 우리는 학생들의 관찰된 점수를 조절하거나 조정합니다. MFRM의 언어로는 중간/조정된 마크를 '공정 평균fair average'이라고 한다. 공정한 평균은 관찰된 표시가 검사자의 관용/긴밀도에 기초하여 조정될 때 발생한다. 두 학생이 심장병 스테이션에서 두 명의 다른 검사관으로부터 동일한 점수를 받는다고 가정해보자. 첫 번째 학생은 비둘기파 시험관에 의해 등급이 매겨졌지만 두 번째 학생은 매파 시험관에 의해 등급이 매겨졌다. 이 두 학생의 점수를 공정하게 비교하기 위해서는 시험관의 관용/엄밀함을 기준으로 이 두 학생을 대상으로 평가된 점수를 조정할 필요가 있다(Linacre 2020). 그렇지 않으면, 이 두 학생의 점수는 그들의 성적과 관련하여 불공평하게 평가될 것이다.
If we consider two examiners, one dovish and the other hawkish, there is no doubt that students are reluctant to be rated by the hawkish examiner. However, both examiners may produce unfair marks. In order to make the students’ marks fair, we moderate or adjust their observed marks. In the language of MFRM, moderated/adjusted marks are called ‘fair average’. The fair average occurs when the observed marks are moderated based on the examiner leniency/stringency. Consider two students receive an equal mark from two different examiners in the cardiology station. The first student was rated by a dovish examiner, but the second student was rated by a hawkish examiner. In order to fairly compare the scores of these two students, we need to adjust the scores assessed for these two students based on the examiner’s leniency/stringency (Linacre 2020). Otherwise, the scores of these two students will be unfairly evaluated relative to their performance.
[공정 평균]의 결과는 심사관의 심각도 분포를 더 잘 이해하기 위해 심사관과 공유할 수 있다. 그림 11은 심사관의 개별 공정 평균에 대한 피드백의 한 가지 예를 제공한다. 적당한 평균 점수는 관용에서 엄격함으로 배열된다. x축(Examiner)에서 문자는 검사자 코드입니다. 따라서, [공정 평균]의 결과는 서로를 식별할 수 없는 상태에서 학생들을 평가한 모든 시험관들에게 제시될 수 있다. 예를 들어, 심사관 J는 그 척도에서 공정 평균 18.50에 가까운 결과를 가져온 판단을 제공하였다. 매파적 수험생인 다른 수험생과 비교해 가장 낮은 점수를 줬다고 판단할 수 있다. L 심사관은 그 척도에서 공정 평균이 거의 32에 달하는 판단을 내렸다. 비둘기파 시험관이 될 가능성이 있는 다른 시험관에 비해 학생들에게 가장 높은 점수를 줬다고 심사관은 판단할 수 있다.
The results of fair averages can be shared with examiners to better understand the examiner severity distribution. Figure 11 provides one example of feedback about examiners’ individual fair averages of the marks. Fair average scores are arranged from leniency to stringency. In the x-axis (Examiner), the letters are the examiner codes. Therefore, the results of fair averages can be presented to all examiners who rated the students without them being able to identify each other. For example, examiner J provided judgments that resulted in a fair average of nearly 18.50 on the scale. The examiner can judge that they gave the lowest score to the students compared to other examiners, a possible hawkish examiner. Examiner L provided judgments that resulted in a fair average of nearly 32 on the scale. The examiner can judge that they gave the highest score to the students compared to other examiners, a possible dovish examiner.

로그를 익숙한 점수로 전송하여 검사자 관련 변형을 피드백합니다.
Transfer logits to a familiar score to feedback examiner-related variation
교사들이 로짓과 변수 맵을 환영하지 않을 경우, 엑셀을 사용하는 일부 간단한 조작은 시험관에게 익숙한 숫자(0과 100 사이)로 척도를 바꿀 수 있다. 따라서 최소 심각도는 0이고 최대 심각도는 100입니다. 이를 위해 래쉬 검사기 성능 및 래쉬 표준 오차 측정이 계산됩니다. 아래 단계를 통해 Rasch 검사자 성능을 0-100 척도로 변환할 수 있습니다(Eckes 2015).
- Rasch 검사기 성능, S=(최대 로짓-분 로짓)/100 사용,
- SE=(각 검사자 * S에 대한 S.E.)
- M = 0-(분 로짓-S) 및
- Excel에서 0-100 스케일을 얻으려면 , = Round(M+(Rasch 측정 성능 + S), 0.
If teachers do not welcome logits and the variable map, some simple operations using Excel can turn scales into numbers (for example, between 0 and 100) that are familiar to examiners. Therefore, the minimum severity measure is zero, and the maximum severity measure is 100. To achieve this, the Rasch examiner performance and the Rasch standard error measure are calculated. By the following steps below, we could convert the Rasch examiner performance to the 0–100 scale (Eckes 2015).
- Using the Rasch examiner performance; S= (max logits- min logits)/100,
- SE=(S.E. for each examiner * S),
- M= 0-(min logits-S), and
- To get the 0-100 scale in Excel; =Round(M+(the Rasch measure performance + S),0).
예를 들어, 검사자 X의 측정값이 S인 0.16이라고 가정합니다.E는 0.26으로, 그들의 새로운 점수는 새로운 척도에서 52점이다. 우리는 성과 변동성 심사관을 위한 새로운 척도를 계산한 다음 이 점수를 주어 서로 비교할 수 있다. 구간 척도를 순서 척도(예: 비둘기 척도, 평균 척도 및 매 척도)로 변환할 수도 있습니다. 또한 엄격하고 관대한 검사자의 수를 계산할 수 있습니다.
For example, suppose the examiner X has a measure of 0.16 with an S.E of 0.26; their new score is 52 points on the new scale. We can calculate the new scale for performance variability examiners and then give them these scores to compare themselves with each other. You could also convert the interval scale to the ordinal scale (e.g. dovish, average and hawkish). This also allows you to calculate the number of stringent and lenient examiners.
Feedback to support examiners' understanding of the standard-setting process and the performance of students: AMEE Guide No. 145
PMID: 34726546
Abstract
The ratings that judges or examiners use for determining pass marks and students' performance on OSCEs serve a number of essential functions in medical education assessment, and their validity is a pivotal issue. However, some types of errors often occur in ratings that require special efforts to minimise. Rater characteristics (e.g. generosity error, severity error, central tendency error or halo error) may present a source of performance irrelevant variance. Prior literature shows the fundamental problems in student performance measurement attached to judges' or examiners' errors. It also indicates that the control of such errors supports a robust and credible pass mark and thus, accurate student marks. Therefore, for a standard-setter who identifies the pass mark and an examiner who rates student performance in OSCEs, proper, user-friendly feedback on their standard-setting and ratings is essential for reducing bias. This feedback provides useful avenues for understanding why performance ratings may be irregular and how to improve the quality of ratings. This AMEE Guide discusses various methods of feedback to support examiners' understanding of the performance of students and the standard-setting process with an effort to make inferences from assessments fair, valid and reliable.
Keywords: Feedback; assessment; standard setting.
'Articles (Medical Education) > 평가법 (Portfolio 등)' 카테고리의 다른 글
| 객관식 시험의 사후 분석 AMEE Guide No. 54 (Med Teach, 2011) (0) | 2022.09.09 |
|---|---|
| 수행능력 기반 평가에서 합격선 설정 방법: AMEE Guide No. 85 (Med Teach, 2014) (0) | 2022.09.09 |
| 교육적 평가의 타당화: 시뮬레이션 등을 위한 프라이머(Adv Simul (Lond). 2016) (0) | 2022.08.19 |
| 테크놀로지-강화 평가: 오타와 합의문과 권고(Med Teach, 2022) (0) | 2022.08.18 |
| 논증 이론이 어떻게 평가 타당도에 정보를 제공하는가: 비판적 문헌고찰 (Med Educ, 2022) (0) | 2022.08.06 |