작은 코호트 OSCE에서 방어가능한 합격선 설정하기: 언제 경계선 회귀방법이 효과적인지 이해하기(Med Teach, 2020)
Setting defensible standards in small cohort OSCEs: Understanding better when borderline regression can ‘work’
Matt Homera , Richard Fullerb, Jennifer Hallama and Godfrey Pella

소개
Introduction
특히 고부담 성과 평가에서 합격선 설정은 항상 어려운 과제입니다(Cusimano 1996; Ben-David 2000; Cizek 2012). 경계선 회귀법(BRM)은 표준 설정에 대한 수험자 중심의 접근 방식으로, 스테이션(또는 사례)에서의 응시자 성과는 글로벌 등급에 따라 전체적으로 채점하거나 체크리스트 또는 도메인 기반 채점 도구를 사용하여 두 가지 방식으로 채점됩니다(Kramer 외. 2003; Pell 외. 2010; McKinley and Norcini 2014). BRM에서는 글로벌 성적에 대해 후자의 점수를 회귀하고, 경계선 성적에 해당하는 회귀 모델 예측 점수를 사용하여 시험장 수준 표준을 사후에 설정합니다. 그런 다음 시험 수준 표준은 스테이션 수준 컷 점수의 합계를 기반으로 하며, 표준 측정 오차 사용과 같은 추가적인 결합 수준 표준을 사용할 수 있습니다(Hays 외. 2008).
Standard setting, particularly in high stakes performance assessments, is always challenging (Cusimano 1996; Ben-David 2000; Cizek 2012). The borderline regression method (BRM) is an examinee-centred approach to setting standards (Livingston and Zieky 1982), where candidate performance in stations (or cases) is scored in two different ways: holistically by a global grade, and also with a checklist or domain-based scoring instrument (Kramer et al. 2003; Pell et al. 2010; McKinley and Norcini 2014). Under BRM, the latter score is regressed on the global grade, and the station-level standard is set post hoc using the regression model predicted score corresponding to the borderline grade. The exam-level standard is then based on the aggregate of the station level cut-scores, with the option to employ additional conjunctive level standards such as the use of the standard error of measurement (Hays et al. 2008).
광범위한 맥락에서 BRM은 이제 일반적으로 방어 가능한 표준을 제공하는 것으로 인정받고 있으며, 많은 고위험 성과 평가 맥락에서 기본 접근 방식이 되었습니다(Boursicot 외. 2007; McKinley와 Norcini 2014). BRM은 경계선 그룹이 아닌 평가자와 응시자 간의 모든 상호작용을 사용하여 커트라인 점수를 설정함으로써 다른 경계선 방법과 비교하여 추가적인 이점을 제공합니다. 예를 들어, 스테이션을 두 가지 방식으로 채점한다는 것은 BRM 하에서 평가 품질에 대한 자세한 통찰력을 제공하는 다양한 스테이션 및 시험 수준의 추가 지표가 있다는 것을 의미합니다(Pell 외. 2010). 또한 이러한 지표를 통해 평가 개선을 위한 개입의 영향을 종단적으로 측정할 수 있습니다(풀러 외. 2013).
Across a broad set of contexts, BRM is now generally acknowledged as providing defensible standards and has become the default approach in many high stakes performance assessment contexts (Boursicot et al. 2007; McKinley and Norcini 2014). By using all interactions between assessors and candidates to set the cut-score rather than just the borderline group, BRM brings additional benefits in comparison to other borderline methods. For example, having stations scored in two different ways mean that under BRM there are a range of additional station- and exam-level metrics which give detailed insight into assessment quality (Pell et al. 2010). These metrics also allow for the impact of interventions aimed at improving assessments to be measured longitudinally (Fuller et al. 2013).
BRM 문헌의 대부분은 상대적으로 '대규모' 코호트(즉, n > 50)를 대상으로 한 평가에서 생성되며, 후보자 그룹은 일반적으로 높은 성과를 보이는 집단(예: 의과대학의 한 학년 그룹 또는 대학원 지원자 코호트)입니다. BRM이 효과적으로 작동하려면 체크리스트 점수 및 글로벌 성적의 범위가 커트라인 점수를 비교적 안정적으로 추정할 수 있을 정도로 충분해야 하므로, 상대적으로 큰 표본 크기는 코호트 전체의 성과가 높더라도 BRM 적용을 뒷받침할 수 있는 후보자 능력의 충분한 확산을 보장하는 데 도움이 됩니다.
The majority of the BRM literature is generated from assessments with relatively ‘large’ cohorts (i.e. n > 50) where the candidate group is typically high-performing (i.e. a single year group at medical school, or a cohort of post-graduate candidates). For BRM to function effectively, the range of checklist marks and global grades should be sufficient to provide a comparatively stable estimate of the cut-score, and so relatively large sample sizes help to ensure sufficient spread in candidate ability to support the application of BRM, despite the cohort as a whole being high-performing.
BRM을 검증하는 대부분의 문헌에서는 리샘플링 접근법 또는 회귀 기반 공식을 통해 다양한 경험적 접근법을 사용하여 산출된 컷 점수의 오차를 추정했습니다. 이 오차를 추정하는 것은 일반적으로 특정 표준 설정 접근법과 관련된 타당도 증거의 중요한 구성 요소로 간주됩니다(미국 교육 연구 협회 2014, 108페이지). 증거에 따르면 다른 표준 설정 접근법에 비해 BRM은 적당한 후보 표본 크기(n > 50)에서 오차가 더 낮습니다. 리샘플링 기반 연구에서는 더 큰 코호트의 데이터를 사용하여 더 작은 표본(n <50)에 대한 컷 점수 오차를 추정하려고 시도했으며, 50명 미만의 후보 코호트 규모에서는 컷 점수의 추정 오차가 상당히 커지는 것으로 나타났습니다(Homer et al. 2016).
Most of the literature validating BRM has used a range of empirical approaches to estimate the error in the cut-score it produces – either through resampling approaches (Muijtjens et al. 2003; Homer et al. 2016) or via regression-based formulae (Kramer et al. 2003; Wood et al. 2006; Hejri et al. 2013). Estimating this error is generally considered as an important constituent of validity evidence linked to a particular standard setting approach (American Educational Research Association 2014, p. 108). The evidence suggests that in comparison with other standard setting approaches, BRM has lower error at modest candidate sample sizes (n > 50). The resampling-based work has also attempted to use data from larger cohorts to extrapolate cut-score error for smaller samples (n < 50), and indicates that the estimated error in the cut-score becomes quite large at cohort sizes below 50 candidates (Homer et al. 2016).
이러한 표준 설정 문제에 직면한 소규모 코호트를 보유한 기관은 일반적으로 전문가 그룹에 의해 체크리스트 항목 또는 더 일반적으로는 스테이션 수준의 난이도를 선험적으로 판단하는 앙고프형 방법과 같은 시험 중심 접근 방식에 의존해 왔습니다(McKinley and Norcini 2014). 이러한 방법은 시간과 자원이 많이 소요될 수 있으며, '합격'을 개념화한 다음 복잡한 OSCE 스테이션 내에서 상호 의존적인(그리고 관찰되지 않는) 일련의 활동에 대한 합격 기준을 명확히 하는 것이 어렵기 때문에 그 자체로 특별히 신뢰할 수 없을 수 있습니다(Boulet et al. 2003). 시험 중심의 표준 설정 방법의 문제점을 탐구하는 대부분의 증거는 지식 테스트의 맥락에서 개발되었습니다(Clauser 외. 2009; Margolis 외. 2016). 응시자가 당일에 실제로 어떻게 수행하는지, 즉 '현실 점검'이 아니라, 단순히 스테이션 내용에 대한 지식만을 바탕으로 OSCE 스테이션에서 최소한의 역량을 반영하는 점수를 판단할 때 유사한 문제가 발생하지 않을 것이라고 상상하기는 어렵습니다. 이 특정 지점에 대한 문헌에는 모순된 증거가 있는 것으로 보이며, 일부에서는 앙고프 유형의 접근 방식이 BRM보다 성과가 낮다는 데 동의합니다(Schoonheim-Klein 외. 2009). 그러나 최근의 연구 결과에 대한 해석은 동일한 시험에서 주니어 레지던트와 시니어 레지던트에 대해 두 가지 표준을 설정하려는 시도로 인해 복잡해졌지만, 앙고프형 접근법이 OSCE에서 어느 정도 효과가 있다고 주장합니다(Dwyer 등. 2016). 이러한 새로운 증거에도 불구하고, 앙고프의 자원 집약적 특성과 다양한 고위험 평가 형식에 사용될 때 그 효과에 대한 의구심은 여전히 남아 있습니다.
Faced with these standard setting challenges, institutions with small cohorts have generally relied on test-centred approaches such as Angoff-type methods where checklist item or more commonly, station-level difficulty is judged a priori by a group of experts (McKinley and Norcini 2014). These methods can be time-consuming and resource intensive, and may not be particularly reliable in themselves – the difficulty of conceptualising the ‘just passing’ candidate, and then articulating a passing standard for a series of interdependent (and unobserved) activities within a complex OSCE station can prove difficult in practice (Boulet et al. 2003). Most of the evidence exploring the problems with test-centred standard setting methods have been developed in the context of knowledge testing (Clauser et al. 2009; Margolis et al. 2016). It is difficult to imagine that judging what scores would reflect the minimally competent performance in an OSCE station based merely on knowledge of the station content, rather than how candidates actually perform on the day – the ‘reality check’ (Livingston and Zieky 1982), would not encounter similar problems. There appears to be contradictory evidence in the literature on this specific point with some agreeing that Angoff-type approached performs less well than BRM (Schoonheim-Klein et al. 2009). However, more recent work argues that Angoff-type approaches can work to an extent in OSCEs (Dwyer et al. 2016) although interpretation of the findings in this particular paper is complicated by an attempt in it to set two standards, for junior and senior residents, in the same examination. Despite this newer evidence, the resource intensive nature of Angoff, and the doubts about its efficacy when employed in a range of high stakes assessment formats, remain.
소규모 코호트에서 적절하고 방어 가능한 표준 설정의 어려움에 대한 조사
Investigating the challenge of appropriate, defensible standard setting in small cohorts
이 백서에서는 훈련된 임상 평가자가 있는 소규모 코호트에서 BRM이 방어 가능한 표준을 제공할 수 있는 조건에 관한 보다 맥락화된 증거 기반을 개발하기 위해 다양한 소규모 코호트 맥락에서 BRM의 사용을 조사합니다. 특히 소규모 코호트에서 표준 설정에 이 접근법을 사용할 때 발생하는 문제(및 그 유병률)를 더 잘 이해하는 데 관심이 있습니다. 연구실 수준의 품질을 측정하는 주요 지표로, 글로벌 등급과 체크리스트 점수 사이의 선형적 연관성의 강도를 측정하는 R-제곱을 사용합니다(Pell 외. 2010). 공식적으로 이는 두 점수 간의 공유 분산 비율을 정량화하며, 높은 값(예: 0.8)은 강한 연관성을 나타내며 BRM에 따른 점수 및 표준 설정의 유효성에 대한 증거를 제공하는 반면, 낮은 값(예: 0.4 또는 0.5 미만)은 스테이션에 잠재적으로 문제가 있음을 나타냅니다((Pell et al. 2010). 또한 점수의 확산 정도를 평가하기 위해 분산 그래프를 육안으로 검사하며, 방법 섹션에서 접근 방식에 대한 자세한 내용을 제공합니다.
In this paper we investigate the use of BRM in a range of different small cohort contexts in order to develop a more contextualized evidence-base regarding the conditions under which BRM in small cohorts with trained clinical assessors might provide defensible standards. We are particularly interested in better understanding the issues (and their prevalence) that arise when using this approach to standard setting in small cohorts. As our main metric of station-level quality, we use R-squared, the measure of the strength of linear association between the global grade and the checklist-score (Pell et al. 2010). Formally, this quantifies the proportion of shared variance between the two scores, with high values (e.g. 0.8) indicating a strong association and providing some evidence of validity in the scoring and standard setting under BRM, whereas low values (e.g. less than 0.4 or 0.5) potentially signify problems in the station ((Pell et al. 2010). We also employ visual inspection of scatter graphs to assess the degree of spread in scores – we give more details of our approach in methods section.
이 논문은 시험장 수준에서의 표준 설정에 초점을 맞추고 있으며, 시험 수준에서의 결합 표준 사용과 관련된 더 광범위한 시험 문제(예: 통과된 최소 시험장 또는 측정 표준 오차)는 다루지 않습니다(Cizek and Bunch 2007, 2장; Hays et al. 2008). 소규모 코호트 성능 테스트에서 이러한 결합 표준을 사용하는 것은 별도의 조사가 필요합니다.
This paper focuses on standard setting at station level and does not explore wider examination issues related to the use of conjunctive standards at the test level (e.g. minimum stations passed or standard errors of measurement) (Cizek and Bunch 2007, chap. 2; Hays et al. 2008). The use of these conjunctive standards in small cohort performance testing merits separate investigation.
소규모 코호트를 사용한 평가 상황
Assessment contexts with small cohorts
우리는 상당히 다른 세 가지 고부담 평가 맥락에서 BRM의 사용을 조사합니다:
We investigate the use of BRM in three quite different high stakes assessment contexts:
영국에서 의사를 개업하기 위해 전문의 등록을 원하는 국제 의대 졸업생을 대상으로 하는 OSCE 시험
The OSCE for international medical graduates seeking professional registration to practice medicine in the UK
이 시험은 영국의 일반 의학 위원회(GMC)에서 시행하며, PLAB - 전문 및 언어 평가 위원회 시험(General Medical Council 2019)이라고 하는 일련의 지식 및 수행 능력 테스트의 일부입니다. OSCE 구성요소(PLAB2)는 영국에서 수련받은 의사가 의과대학을 졸업하고 대학원 수련의 첫 번째 파운데이션 연도를 마친 후 2년차 진료 첫날에 볼 수 있는 임상 진료의 모든 측면을 다루도록 설계되었습니다.
- 시험은 18개의 스테이션으로 구성되며, 임상적으로 훈련된 평가자가 수행 능력을 종합적으로 판단하여 4점 만점(0 = 불만족, 1 = 경계선, 2 = 만족, 3 = 양호)으로 각각 점수를 매깁니다.
- 또한 응시자는 세 가지 영역(데이터 수집, 기술 및 평가 기술, 임상 관리 기술, 대인관계 기술)에서 점수를 받습니다.
- 각 영역은 4점 척도로 채점되며, 이 점수는 12점 만점의 총점으로 합산됩니다.
This examination is administered by the General Medical Council (GMC) in the UK and is part of a sequence of knowledge and performance testing referred to as PLAB – Professional and Linguistic Assessment Board test (General Medical Council 2019). The OSCE component (PLAB2) is designed to cover all aspects of clinical practice a UK-trained doctor might expect see during their first day of their second year of medical practice following graduation from medical school and completion of the first Foundation Year of postgraduate training.
- The examination consists of 18 stations which are each scored by clinically trained assessors via a holistic judgement of the performance in a four-point global grade (0 = unsatisfactory, 1 = borderline, 2 = satisfactory, 3 = good).
- Candidates are also scored in three separate domains (Data gathering, technical and assessment skills, Clinical management skills, and Interpersonal skills).
- Each domain is scored on a 4-point scale and these are aggregated to a total station score out of 12.
각 PLAB2 시험은 오전과 오후로 나누어 진행되며, 일반적으로 각 시험장에 동일한 평가자가 배치되고, 30-35명의 응시자에 대한 모든 평가 결과를 합산하여 당일의 BRM 표준 설정에 반영합니다. 즉, 각 시험은 표준 설정 측면에서 서로 독립적으로 취급되며, 해당 날짜의 데이터만 BRM에 따른 커트라인 점수를 계산하는 데 사용됩니다. PLAB2에 응시하려면 응시자는 PLAB1 응용 지식 시험을 통과해야 합니다. PLAB2는 연간 100회 정도 시행되며, 이 백서에 사용된 스테이션 레벨 데이터는 2016년 9월부터 2018년 10월까지 198회 시행된 시험으로 구성되어 있습니다. PLAB2를 대량으로 시행하려면 기본적으로 표준 설정이 수험자 중심으로 이루어져야 하며(즉, 사후에), 2016년부터 BRM이 사용되었습니다.
Each PLAB2 administration consists of a morning and afternoon circuit, usually with the same assessors in each station, with all assessment outcomes for the 30-35 candidates combined for the BRM standard setting for the day – in other words, each administration is treated independently of any other in terms of standard-setting, and only data from the day in question is used to calculate cut-scores under BRM. In order to sit PLAB2, candidates have to pass the PLAB1 applied knowledge test. There are of the order of 100 administrations of PLAB2 per year, and the station level-data used in this paper consists of 198 test administrations over September 2016 to October 2018. The large volume of PLAB2 administrations essentially necessitates standard setting to be examinee-centred (i.e. post hoc), and BRM has been used since 2016.
이 연구의 PLAB2 스테이션은 총 264개의 스테이션 뱅크에서 추출되었으며, 198개의 관리 각각에 대해 적절한 청사진 프로세스를 수행하여 시험에서 각 18개의 스테이션 세트를 선택했습니다. 그 결과, 개별 스테이션의 사용 빈도는 데이터에서 1에서 48까지 다양하며, 해당 기간 동안 평균은 11입니다. 스테이션 수준 데이터는 컷 점수, R-제곱, 스테이션 삭제시 신뢰도 계수(스테이션을 제거한 전체 시험의 신뢰도), 스테이션 '쉬움'(즉, 각 관리의 스테이션 합격률)과 같은 다양한 스테이션 및 시험 수준 지표(Pell et al. 2010)로 구성됩니다. 또한 각 시험의 각 스테이션에 대한 전체 영역 점수 대비 글로벌 성적의 분산 그래프도 시각적으로 확인할 수 있습니다.
PLAB2 stations in this study were drawn from a bank of 264 stations in total, and an appropriate blueprinting process was carried out for each of the 198 administrations to select each set of 18 stations in the exam. As a consequence, the frequency of use of any individual station varies in the data, ranging from 1 to 48 with a median of 11 over the period. Station-level data consists of a range of station and test-level metrics (Pell et al. 2010) such as the cut-score, R-squared, reliability coefficient-station-deleted (reliability of the overall exam with station removed), and station ‘facility’ (i.e. station pass rate for each administration). In addition, scatter graphs of global grades versus total domain scores for each station in each administration are also available for visual inspection.
영국 의과대학 학부생들을 위한 순차적 OSCE의 두 번째 파트
The second part of a sequential OSCE for undergraduate medical students in a UK medical school
평가에 대한 보다 혁신적인 접근 방식의 일환으로, 시험에 대한 적응형 접근 방식이 개발되면서 평가가 두 부분으로 나누어 실시되는 순차적 시험 모델이 도입되었습니다. 모든 응시자를 대상으로 하는 초기 선별 OSCE와 취약한 응시자를 위한 추가 시퀀스는 적응형 시험 형식과 전반적으로 향상된 의사 결정을 모두 제공합니다(Pell 외. 2013; Homer 외. 2018). 이 연구의 일부는 약 300명의 학생으로 구성된 전체 코호트가 초기 선별 시퀀스를 치르고 20-50명의 학생이 두 번째 시퀀스 OSCE를 치르기 위해 소환되는 4학년과 5학년(예선) OSCE의 연구를 기반으로 합니다. 이 소규모 응시자 집단에 대한 합격/불합격 결정은 두 시퀀스(4학년과 5학년에서 각각 총 26개, 25개 스테이션)에서의 성적을 기준으로 이루어집니다.
As part of more innovative approaches to assessment, the development of adaptive approaches to testing has seen the introduction of sequential testing models, where assessment is delivered in two parts. An initial screening OSCE for all candidates, with a further sequence for weaker candidates provide both an adaptive test format and overall enhanced decision-making (Pell et al. 2013; Homer et al. 2018). This part of the study draws on work from Year 4 and Year 5 (qualifying) OSCEs, where the full cohort of approximately 300 students take the initial screening sequence, with 20-50 students being recalled to sit the second sequence OSCE. Pass/fail decisions for this smaller cohort of candidates are made based on performance across both sequences (26 and 25 stations in total in Years 4 and 5, respectively).
임상 평가자는 주요 특징 체크리스트(Farmer and Page 2005)와 5점 척도(0 = 불합격, 1 = 경계선, 2 = 합격, 3 = 양호 합격, 4 = 우수 합격)를 사용하여 스테이션에 점수를 매깁니다. 6번의 시퀀스 2 관리(2017~2019년 포함)의 후보자 수준 데이터를 고려합니다. 시퀀스 2에서 사용하도록 선택된 스테이션은 이전 시퀀스 1 투여에서 사용되었으므로 전체 코호트에서 BRM을 만족스럽게 사용하여 생성된 기존 합격 점수가 있는 스테이션입니다(즉, R-제곱과 같은 지표가 충분히 양호함).
Stations are scored by clinical assessors using key features checklist (Farmer and Page 2005) and a global grade on a five-point scale – 0 = fail, 1 = borderline, 2 = pass, 3 = good pass, 4 = excellent pass. We consider candidate-level data from six sequence 2 administrations (2017–2019 inclusive). Stations selected for use in sequence 2 are those that have been used in a previous sequence 1 administration, and so have pre-existing passing scores generated from the satisfactory use of BRM in the full cohort (i.e. with sufficiently good metrics such as R-squared).
어떤 이유로든 새 시행의 BRM 표준에 문제가 있는 경우 BRM 또는 이전 합격 점수로 대체하여 표준 설정이 수행됩니다. 우리 연구의 일부는 이러한 대체가 얼마나 자주 필요한지 정량화하는 것입니다.
- 첫 번째 시퀀스의 경우 사후 분석을 통해 평가자 불균형 측정을 포함한 정교한 범위의 시험 및 시험장 수준 메트릭을 제공합니다(Pell 외. 2010, 2015).
- 그러나 두 번째 시퀀스의 경우, 상대적으로 작은 응시자 하위 그룹의 비정형적인 특성을 고려할 때 이러한 분석은 필연적으로 제한적입니다.
이 2차 시퀀스 분석에서는 체크리스트 점수 및 관련 지표(예: R-제곱)에 대한 성적의 분산 그래프에 중점을 둡니다.
Standard setting is undertaken by BRM or substitution with previous pass marks if there is a concern, for any reason, with the BRM standards in the new administration. Part of our research is to quantify how often this substitution might prove necessary.
- For the first sequence, post-hoc analysis provides a sophisticated range of test- and station level metrics, including measures of assessor disparity (Pell et al. 2010, 2015).
- However, for the second sequence, such analysis is necessarily limited, given the atypical nature of this relatively small sub-group of candidates.
The focus in this sequence 2 analysis is on scatter graphs of grades versus checklist scores and associated metrics (e.g. R-squared).
영국 의과대학의 의사 보조원을 위한 OSCE
OSCEs for physician associates in a UK medical school
의사 보조원(PA, 미국에서는 '의사 보조원')은 영국에서 비교적 최근에 등장한 의료 전문가입니다. 교육 프로그램은 일반적으로 2년제 대학 석사 수준의 자격을 제공하는 대학원 입학 프로그램으로 구성되며, 그 후 신입 PA는 정식 자격을 갖춘 의사와 함께 팀의 일원으로 실습을 하게 됩니다(Health Education England 2015). 리즈 대학교 PA 프로그램은 연말에 실시되는 고난도 OSCE를 포함하여 다양한 지식, 성과 및 전문성 평가를 통해 평가됩니다. 일반적으로 20~30명의 학생으로 구성된 코호트는 임상 평가자가 5점 만점 글로벌 등급과 주요 기능 체크리스트(상황 2에서와 같이)를 통해 스테이션을 채점하는 '전통적인 단일 시험 OSCE'를 사용하여 평가됩니다.
A physician associate (PA, ‘physician assistant’ in the US) is a relatively new healthcare professional in the UK. The training programme typically consists of a graduate entry programme which provides a two-year university Masters-level qualification, following which new PAs practice as part of a team alongside fully qualified doctors (Health Education England 2015). The University of Leeds PA programme is assessed through a range of knowledge, performance and professional assessments, including end of year high stakes OSCEs. A cohort of typically 20–30 students are assessed using a ‘traditional single test OSCE’, where stations are scored by clinical assessors via a five-point global grade, and key features checklist (as in context 2).
이 연구에서는 4개 시험(2018년과 2019년의 Y1 및 Y2)의 PA 후보자 수준 데이터를 사용합니다. 표준은 일반적으로 시험장 수준에서 수정된 Angoff 방법을 사용하여 설정되며(McKinley and Norcini 2014), 본 연구의 일부는 BRM이 이러한 시험에서 표준 설정의 대체 또는 최소한 기본 접근법으로 사용될 수 있는 범위를 탐색합니다. 결과적으로 앙고프 표준 설정의 적용으로 인해 제한된 범위의 사후 분석 품질 데이터(예: 스테이션 수준 시설, R-제곱, 분산 그래프 검사)를 사용할 수 있습니다.
In this study, we use PA candidate-level data from four administrations (Y1 and Y2 in 2018 and 2019). Standards are usually set using a modified Angoff method at the station level (McKinley and Norcini 2014), and part of our research explores the extent to which BRM can be used as a replacement or, at least, as the default approach to standard setting in these exams. Consequent to the application of Angoff standard setting, a limited range of post hoc analysis quality data is available (e.g. station level facility, R-squared, scatter graph inspection).
방법
Methods
세 가지 후보 상황 모두에서 공통적으로 사용되는 방법
Common methods across all three candidate contexts
위에서 설명한 대로 다양한 스테이션 수준 데이터를 사용하여 스테이션 및 테스트 수준 메트릭을 조사하고 스테이션의 글로벌 등급과 총 주요 기능/도메인 점수 간의 관계를 조사합니다(Pell 외. 2010). R-제곱 값이 '낮은'(예: 0.4 미만) 스테이션의 경우(Pell 외. 2010), 각 스테이션 내에서 등급과 점수가 충분한 변동을 보이는 정도도 평가합니다. 전반적인 접근 방식은 체크리스트/영역 점수와 글로벌 등급 간의 충분히 만족스러운 양의 관계와 각 스테이션 내 등급/점수의 적절한 분포를 기반으로 스테이션 수준에서 BRM이 '작동'하고 있다는 증거가 있는지 평가하는 것입니다.
Using a range of station-level data as detailed above, we investigate station- and test-level metrics and examine the relationship between global grades and total key feature/domain scores in stations (Pell et al. 2010). For stations with ‘low’ R-Squared value (e.g. below 0.4) (Pell et al. 2010), we also assess the extent to which grades and scores show sufficient variation within each station. Our overall approach is to assess whether there is evidence that BRM is ‘working’ at the station level – based on a sufficiently satisfactory positive relationship between checklist/domain scores and global grades, and an adequate spread of grades/scores within each station.
PLAB2 시험에 특정한 방법
Methods specific to PLAB2 exams
PLAB2 데이터의 경우, 위에서 설명한 일반적인 분석 외에도 시험장 수준(n = 3645)에서 간단한 기술 및 상관 분석 방법을 사용하여 컷 점수, 시설(합격률) 및 R-제곱 값 간의 관계를 조사하고 여러 행정부에 걸쳐 동일한 시험장에서 컷 점수가 달라지는 정도를 측정합니다.
For the PLAB2 data, in addition to the common analyses outlined above, we also use simple descriptive and correlational methods at the station level (n = 3645) to probe the relationships between cut-scores, facility (pass rate) and R-squared values, and to measure the extent to which cut scores vary for the same station across multiple administrations.
순차적 시험에 특화된 방법
Methods specific to sequential exams
순차적 시험의 경우, BRM에서 설정한 표준을 이전 시험의 주요 코호트에서 생성된 표준과 비교하여 상당히 다른 학생 코호트에서 표준의 일관성을 평가합니다. 이 논문에서 고려한 다른 두 가지 상황과 달리, 2차 시험에 응시한 학생들은 1차 시험에서 충분히 우수한 성적을 거두지 못했기 때문에 이것만으로는 '합격'할 수 없다는 점에서 전체 코호트를 대표하지 않는다는 점에서 '극단적인 하위 집단'이라고 정의할 수 있습니다. 이는 전통적인 '재시험 OSCE'와 같이 시험장 및 시험 품질을 보장하는 데 사용되는 일반적인 측정 항목의 적절한 해석에 영향을 미칩니다(Pell 외. 2010). 점수의 범위가 제한적이어서 점수 간 상관관계가 낮을 가능성이 높고(Bland and Altman 2011), 전체 코호트에서 사용할 때보다 스테이션 실패율이 높을 것으로 예상되기 때문에 일반적인 신뢰도 측정은 일반적으로 적절하지 않습니다.
For the sequential context, we also compare the BRM-set standards with those generated from main cohorts in a previous administration in order to assess the consistency of the standards across these quite different cohorts of students. In contrast to the other two contexts considered in this paper, the students sitting the sequence two examinations are by definition an ‘extreme sub-group’ in the sense that they are not representative of the full cohort, having failed to perform sufficiently strongly in the first sequence to ‘pass’ based on this alone. This has implications for the appropriate interpretation of the usual range of metrics used for assuring station and exam quality, akin to a traditional ‘resit OSCE’ (Pell et al. 2010). Typical measures of reliability are not usually appropriate as scores are likely to have a limited range which lowers correlation between scores (Bland and Altman 2011), and station failure rates will be expected to be high compared to when used in the full cohort.
PA 시험에 특화된 방법
Methods specific to the PA exams
PA 시험의 경우, 현재 실제 표준을 제공하기 위해 사용되는 수정된 앙고프 접근법의 표준과 스테이션 수준 및 전체 BRM 표준도 비교합니다. 이러한 비교 작업을 통해 BRM이 설정한 표준에 대한 추가적인 타당성 증거를 제공할 수 있습니다. 다른 두 가지 컨텍스트인 PLAB2와 Sequential의 경우, 앙고프 판단을 사용할 수 없으므로 이러한 추가 분석이 불가능합니다. 또한 재샘플링 접근법을 사용하여 각 시험에서 전체 합격 점수의 표준 오차를 계산합니다(Homer et al. 2016).
For the PA exam, we also compare station-level and overall BRM standards with those from the modified Angoff approach that is currently employed to provide the actual standard. This comparative work allows for the possibility of providing additional validity evidence for the BRM-set standards. Note that for the other two contexts, PLAB2 and Sequential, Angoff judgements are not available so this additional analysis is not possible. We also calculate the standard error of the overall pass mark in each exam using a resampling approach (Homer et al. 2016).
결과
Results
각 상황을 차례로 살펴보고 각 상황에서 수행한 주요 분석을 요약하여 BRM이 방어 가능한 표준을 제공하고 있다는 증거를 평가합니다. 먼저 시험의 전반적인 신뢰도를 살펴본 다음 BRM별 분석으로 넘어갑니다.
We take each context in turn and summarise the key analyses we have carried out in each to assess the evidence that BRM is providing defensible standards. We first give the overall reliability of the exams and then move on to the BRM-specific analysis.
PLAB2 시험
PLAB2 exams
크론바흐 알파로 측정한 198개 18개 스테이션 시험의 신뢰도는 198개 알파 값 분포의 5번째, 50번째, 95번째 백분위수가 각각 0.64, 0.79, 0.87로 전반적으로 양호한 수준입니다.
The reliability of these 198 18-station examinations, as measured by Cronbach’s alpha, is generally good with the 5th, 50th and 95th percentiles of the distribution of 198 alpha values being 0.64, 0.79, and 0.87, respectively.
글로벌 성적과 도메인 점수 간의 관계의 강도(R-제곱)
The strength of the relationship between global grades and domain scores (R-squared)
주요 분석을 위해 먼저 198개 시행의 R-제곱 값의 분포를 살펴봅니다. 분석 대상인 3,564개 시행의 평균 R-제곱 값은 0.75입니다(표준 편차 0.12, 5, 50 및 95번째 백분위수 = 각각 0.51, 0.77, 0.89). 이 데이터는 대부분의 시험장에서 글로벌 성적과 도메인 점수 간의 관계 강도가 매우 우수하다는 것을 나타내며, 이는 BRM이 일반적으로 이 시험에 대해 방어 가능한 표준을 제공하고 있음을 시사합니다(Pell 외. 2010).
For our main analysis, we first look at the distribution of R-squared values across the 198 administrations. Across the 3,564 stations in the analysis, the mean value of R-squared is 0.75 (standard deviation 0.12; 5th, 50th and 95th percentiles = 0.51, 0.77, 0.89, respectively). This data indicates that in the vast majority of these stations the strength of the relationship between global grades and domain scores is very good – in turn suggesting that BRM is generally providing defensible standards for this examination (Pell et al. 2010).
R-제곱 값이 상대적으로 낮은 경우, 이는 도메인 점수가 서로 다른 글로벌 등급 간에 변별력이 크지 않다는 것을 의미합니다(Pell et al. 2010). 전체 데이터 세트에서 가장 극단적인 예(R-제곱 = 0.10)는 그림 1에 나와 있습니다(환자가 비뇨기 질환을 호소하는 스테이션):
Where the value of R-squared is relatively low, this implies that the domain scores are not discriminating strongly between different global grades (Pell et al. 2010). The most extreme example in the whole data set (R-squared = 0.10) is shown in Figure 1 (a station where a patient presents with a urinary problem):

이 스테이션의 단일 시험에 대한 이 스테이션 수준 도표는 글로벌 성적과 도메인 '점수' 간의 상관 관계를 강조합니다. 플롯의 각 '점'은 개별 평가자-응시자 관찰을 나타내며, 더 큰 '점'은 동일한 관찰/점수가 많음을 반영합니다. 그림 1에서는 대부분의 응시자가 전체 성적과 영역 점수 모두에서 상당히 높은 점수를 받고 있으며, 이 두 가지 측정치 모두에서 변별력이 상대적으로 부족합니다.
This station level plot of a single administration of this station highlights the degree of correlation between a global grade and domain ‘score’. Each ‘dot’ on the plot represents an individual assessor-candidate observation, with bigger ‘dots’ reflecting a number of identical observation/scores. In Figure 1, there is a relative lack of discrimination in scores – most candidates are scoring quite highly in both global grades and domain scores, and there is a lack of spread in both of these measures.
이 중요한 지표의 값이 이처럼 낮다면, 표준 세트의 방어 가능성에 어떤 영향을 미칠까요? 일반적으로 전체 PLAB2 데이터 세트에서 스테이션의 R-제곱 값과 해당 스테이션 수준의 컷 점수 사이에는 약한 음의 상관관계가 있는 것으로 나타났습니다(r = -0.13, n = 3564, p < .001). 이는 R-제곱 값이 낮을수록 일반적으로 약간 높은 컷 점수와 연관되어 잠재적으로 더 높은 실패율을 초래할 수 있음을 시사합니다.
For such poor values of this important metric, the key question is what the impact is on the defensibility of the standard set? In general, across the full PLAB2 dataset, we find there is a weak negative correlation between R-squared values in stations and corresponding station-level cut-scores (r = −0.13, n = 3564, p < .001). This suggests that low values of R-squared are typically associated with slightly higher cut-scores, potentially leading to higher failure rates.
비뇨기 스테이션(그림 1에 표시된 단일 투여)은 해당 기간 동안 22회 시행되었습니다. 흥미롭게도, 이들 시행의 R-제곱 중앙값은 0.70으로 이 스테이션에서 낮은 R-제곱이 일반적이지 않다는 것을 매우 강력하게 시사하며, 따라서 스테이션 설계의 근본적인 문제라기보다는 개별 평가자 문제이거나 이 특정 관리의 스테이션에서 점수가 분산되지 않은 문제일 가능성이 높습니다. 이 22개 행정 구역의 컷 점수는 표준 편차가 0.86점(척도의 7.2%에 해당)으로 약간의 편차를 보였으며, 그림 1에 표시된 것처럼 R-제곱 값이 가장 낮은 컷 점수가 이 스테이션의 모든 시행에서 가장 높은 컷 점수를 생성합니다. 그러나 데이터 세트 전체에서 R-제곱 값이 낮은 스테이션의 비율은 5% 정도로 낮다는 점을 강조합니다.
The urinary station (single administration shown in Figure 1) has been administered 22 times over the period concerned. Interestingly, the median R-squared across these administrations is 0.70 which very strongly suggests that the low R-squared is not typical for this station, and therefore is likely to be either an individual assessor issue, and/or a problem with lack of spread in the scores in the station in this particular administration, rather than an underlying problem with the station design. The cut-scores across these 22 administrations show some variation, with a standard deviation of 0.86 domain marks (equivalent to 7.2% of the scale) – and the cut-score with the lowest R-squared value (as shown in Figure 1) produces the highest cut-score across all administrations of this station. However, we emphasize that the prevalence of stations with poor R-squared values across the data set as a whole is low (e.g. 5%).
스테이션 수준 통과율
Station level pass rates
스테이션 수준에서의 통과율은 3564개 스테이션 시행의 중앙값이 74%입니다. 이는 일반적으로 상당수의 응시자가 스테이션에서 상대적으로 낮은 점수를 받고 있으며, 대부분의 코호트 내에서 능력의 범위가 상당히 넓다는 것을 나타냅니다. 즉, 각 코호트 내에는 잘하는 응시자 외에도 낮은 점수를 받는 응시자가 상당수 존재한다는 뜻입니다. 이러한 상황에서 BRM을 성공적으로 적용하기 위한 핵심 요건은 스테이션 내 후보자 성과 범위이며, 이 문제는 논의에서 다시 다룰 것입니다.
The pass rate at the station level has a median value of 74% across the 3564 station administrations. This indicates that typically a significant proportion of candidates are scoring relatively poorly in stations, and that there is a reasonably wide range of abilities within most cohorts – in other words, a significant number of candidates with each cohort are receiving low scores in addition to a number of candidates doing well. This range of candidate performances within stations is a key requirement for the successful application of BRM in these contexts, an issue we will return to in the Discussion.
스테이션 내 기준의 변화
Variation in the standard within stations
전체 데이터 세트에서 각 스테이션별 컷 점수의 변동은 (중앙값) 표준 편차가 5.6%로, 일반적으로 BRM에서 설정한 컷 점수가 여러 스테이션에 걸쳐 대체로 안정적이라는 것을 시사합니다.
The variation in cut-scores for each station across the full dataset has a (median) standard deviation of 5.6% which suggests that generally the cut-scores set by BRM are broadly stable across administrations.
시퀀스 2 시험
Sequence 2 exams
이 하위 그룹은 정의상 전체 코호트보다 약하기 때문에 시퀀스 2에 대한 신뢰도 수치를 따로 계산하는 것은 적절하지 않습니다. 대신, 의사 결정 이론을 사용하여 시퀀스 1 점수만을 기반으로 전체 신뢰도를 추정합니다. (Pell 외. 2013). 이러한 맥락에서 전체 시퀀스에 대한 오메가-총계(Revelle and Zinbarg 2009)는 연구된 6개의 검사 각각에 대해 0.80(또는 그 이상)입니다.
It is not appropriate to calculate reliability figures for Sequence 2 in isolation as this sub-group, is by definition, weaker than the full cohort. Instead, we use decision theory to estimate overall reliability based on Sequence 1 scores alone. (Pell et al. 2013). In this context, omega-total (Revelle and Zinbarg 2009) for the full sequence is of the order of 0.80 (or greater) for each of the six examinations studied.
2017년부터 2019년까지 6번의 순차적 시험에서 BRM 지표와 점수 분포가 충분히 만족스러운 것으로 판단되어 해당 커트라인 점수를 두 번째 시험의 표준 설정에 자신 있게 사용할 수 있는 시험장의 수를 표 1에 제시했습니다. 그렇지 않은 경우, 전체 코호트 시행에서 도출된 해당 스테이션의 이전 컷 점수와 만족스러운 BRM 지표가 사용되었습니다.
Across the six sequential examinations from 2017–2019, Table 1 gives the number of stations where BRM metrics and spread of marks were judged sufficiently satisfactory for the corresponding cut scores to be used with confidence in the standard setting for the second part of the sequence. Where this was not the case, the previous cut-score for the station, derived from administration in a full cohort and with satisfactory BRM metrics, was used.

표 1에 요약된 분석에 따르면 BRM은 대부분의 시험장(86%)에서 표준 설정에 대해 실현 가능하고 방어 가능한 접근 방식을 제공합니다. 경계선 회귀가 적용되지 않는 좋은 예가 그림 2에 나와 있는 무릎 시험장(2018년 5학년, 22명의 응시자)입니다. 여기서 문제는 전체 성적의 분산이 부족하여(5개의 가능한 성적 중 2개만 사용됨) R-제곱이 낮고(=0.14), 결과적으로 이 시험의 BRM 합격 점수의 정확성에 대한 우려로 이어진다는 점입니다.
The analysis summarized in Table 1 suggests that BRM provides a feasible, and defensible approach to standard setting in these exams for a large percentage of stations (86%). A good example of where borderline regression is not doing so is shown in Figure 2, a knee examination station (Year 5, 2018, 22 candidates). The problem here is lack of spread in the global grades (only two of five possible grades employed), which leads to a low R-squared (=0.14) and subsequently to concern about the accuracy of the BRM pass mark for this administration.
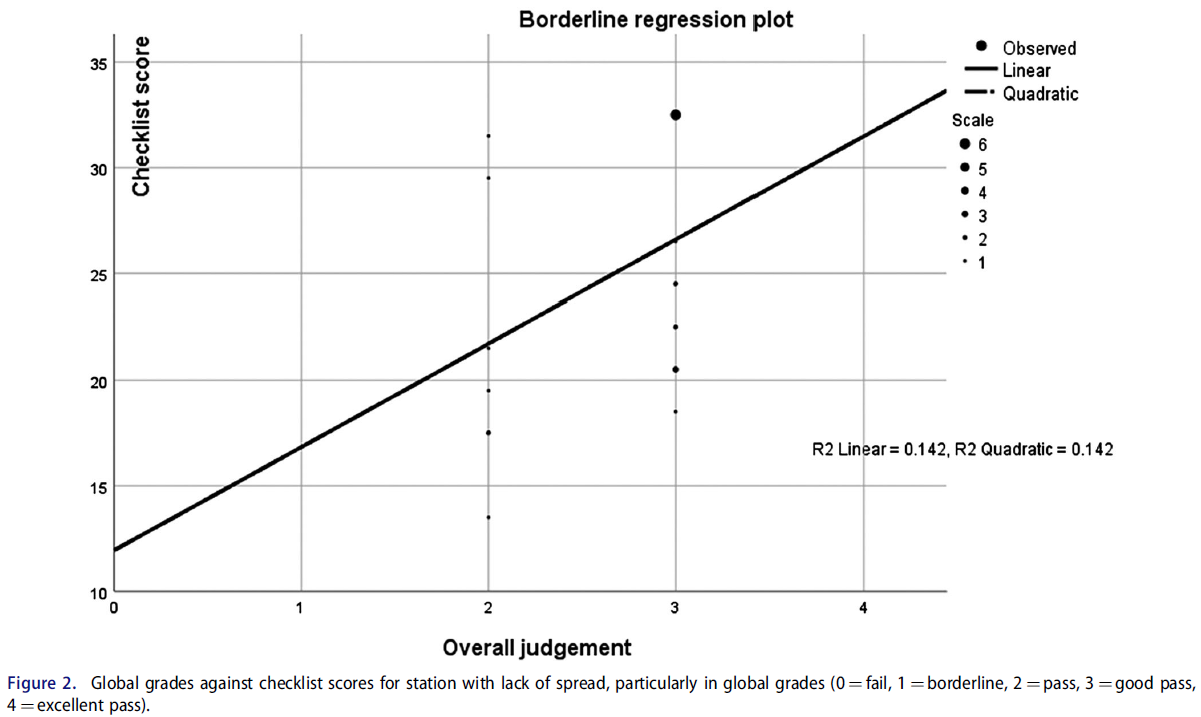
이 스테이션의 경우, 지표가 양호한 전체 코호트에서 이전에 이 스테이션을 사용한 BRM 컷 점수가 선호됩니다.
For this station, the BRM cut-score from a previous use of this station in a full cohort with good metrics is preferred.
주요 코호트 표준과의 비교
Comparison with main cohort standards
다음으로 BRM 소규모 코호트 전체 표준(4년차 및 5년차에 각각 10개 또는 12개의 시퀀스 2 스테이션에 대해)을 이전 전체 코호트 데이터에서 생성된 표준과 비교합니다. 고려 중인 6개의 관리 중 4개의 관리에서 BRM이 소규모 코호트에서 약간 더 높은 표준을 생성하는 경향(5% 정도)이 있는 것으로 보입니다. 이 문제는 분명히 추가 연구의 가치가 있습니다.
We next compare the BRM small cohort overall standard (for the 10 or 12 sequence 2 stations in Year 4 and Year 5, respectively) with that for the standard generated from previous full cohort data. In four out of the six administrations under consideration, there appears to be a tendency for BRM to produce a slightly higher standard in small cohorts (of the order of 5%). This issue is clearly worthy of additional research.
PA 시험
PA exams
2018년의 네 가지 PA 시험 각각에 대해 크론바흐 알파로 계산한 전체 시험 수준의 신뢰도는 각 경우에서 최소 0.80입니다.
Overall test level reliability as calculated by Cronbach’s alpha for each of the four PA examinations from 2018 is at least 0.80 in each case.
표 2에는 분산 그래프와 R-제곱 값을 육안으로 확인한 결과, 각 시험에서 BRM 지표가 만족스러운 것으로 판정된 스테이션 수가 자세히 나와 있습니다. 대부분의 스테이션(88%)에서 데이터에 따르면 BRM 표준을 방어할 수 있는 것으로 나타났습니다.
Table 2 details the number of stations in each examination where BRM metrics were judged satisfactory based on visual inspection of scatter graphs and values of R-squared. We see that in the majority of stations (88%) the data suggest that BRM standards are defensible.

컷 점수의 표준 오차
Standard error of the cut-score
PA 시험에 대한 전체 BRM 합격 점수의 표준 오차는 재샘플링 방법을 사용하여 추정되었으며, 네 번의 시험에서 각각 1% 정도입니다. 이 값은 문헌에서 발견된 주요 시험에서 추정된 값(≈1.4%)보다 낮다는 점에서 허용 가능한 것으로 간주됩니다(Muijtjens 외. 2003; Homer 외. 2016).
The standard errors of the overall BRM pass mark for the PA exams is estimated using resampling methods, and are of the order of 1% across each of the four examinations. These values are considered acceptable, in that they are lower than extrapolated values from main exams found in the literature (≈1.4%) (Muijtjens et al. 2003; Homer et al. 2016).
앙고프 판정과의 비교
Comparison with Angoff judgements
기존 관행의 일환으로, PA OSCE 팀은 각 스테이션에 대해 스테이션을 통과할 수 있는 최소한의 유능한 PA 후보자의 예상 비율을 기준으로 각 스테이션에 대한 앙고프형 판정을 내립니다. 이 접근 방식을 BRM에서 파생된 표준과 비교하는 데는 분명한 관심이 있습니다. 그림 3은 2018년 1차 시험의 산포 그래프로, BRM 기준(가로)과 앙고프 기준(세로)을 비교하여 총 스테이션 점수의 백분율로 계산한 것입니다. 파란색(점선)은 가장 잘 맞는 선(r = 0.68, n = 16, p = .004)이고 주황색(굵은선)은 y = x입니다(즉, 각 표준 설정 방법의 컷 점수가 각 스테이션에서 동일하다면 모두 이 선에 있을 것임):
As part of established practice, the PA OSCE team produces an Angoff-type judgement of each station in terms of the expected proportion of minimally competent PA candidates who would pass the station. There is obvious interest in comparing this approach with a BRM derived standard. Figure 3 gives a scatter graph for the 2018 Year 1 examination comparing BRM standards (horizontally) with those from the Angoff (vertically) – both calculated as the percentage of the total station score. The blue (dashed) line is the line of best fit (r = 0.68, n = 16, p = .004), the orange (bold) line is y = x (i.e. if cut-scores for each standard setting method were the same in each station they would all be on this line):

그림 3은 2018년 1차 PA 시험에서 난이도가 높은 시험장(그래프의 왼쪽 하단)의 경우 Angoff가 BRM(굵은 선 위의 점)에 비해 더 높은 커트 점수를 부여하는 경향이 있고, 쉬운 시험장(오른쪽 상단)의 경우 더 낮은 커트 점수를 부여하는 경향이 있음을 보여줍니다(굵은 선 아래의 점). 이러한 차이로 인해 Angoff는 전체 커트라인 점수가 69% 대 66%로 더 높았으며, 이는 모든 스테이션에서 Angoff가 설정한 커트라인 점수에 해당하는 약 20명의 응시자 코호트에서 한 명의 추가 불합격이 발생한 것과 같습니다.
Figure 3 shows that for more challenging stations (bottom left corner of graph), Angoff tends to give a higher cut-score compared to BRM (dots above the bold line) for the 2018 Year 1 PA exam, and for easier stations (top right) it tends to give a lower cut-score (dots below bold line). These differences result in Angoff giving a higher overall cut-score – 69 vs. 66% for BRM, and this corresponds to one additional failure for the cohort of approximately 20 candidates under an Angoff set cut-score across all stations.
스테이션 수준에서도 2018년 1차 PA 시험에서 앙고프에 따른 개별 스테이션 불합격이 더 많았습니다(78 대 52). 마지막으로, BRM은 합격 점수의 편차가 더 컸습니다. BRM은 스테이션 전체에서 39%의 더 넓은(수평) 범위의 커트라인을 가진 반면, 앵고프(수직) 범위는 19%에 불과했으며, 다른 PA 데이터에서도 비슷한 결과가 나타났습니다. 이러한 분석 결과를 합리적으로 해석하면 BRM은 보다 현실적인 범위의 컷 점수를 산출하는 반면, Angoff 점수는 보다 제한된 범위를 보여줍니다.
At the station level, there are also more individual station failures in the 2018 Year 1 PA exam under Angoff (78 vs. 52). Finally, BRM gives more variation in passing scores – BRM has a broader (horizontal) range of 39% in cut-scores across stations compared to a more constricted Angoff (vertical) range of 19% – with similar findings in the other PA data. A reasonable interpretation of these analyses suggest that BRM is producing a more realistic range of cut-scores, whereas Angoff scores show a more restricted range.
토론
Discussion
세 가지 서로 다른 다양한 소규모 코호트 OSCE 컨텍스트의 대규모 세트 스테이션에서 BRM은 대다수의 스테이션에서 효과적으로 작동하는 것으로 나타났습니다(각 컨텍스트에서 86% 이상). BRM이 만족스러운 스테이션 수준의 지표를 생성하는 경우, 우리는 이것이 높은 위험도 테스트 결과의 사용을 정당화하는 광범위한 유효성 논증에 중요한 증거를 제공한다고 주장합니다(Kane 2013).
Across large set stations from three different and diverse small cohort OSCE contexts, BRM has been shown to function effectively in the vast majority of stations (over 86% in each context). Where BRM produces satisfactory station level metrics, we argue this contributes important evidence towards the wider validity argument in the justification of the use of high stakes test outcomes (Kane 2013).
표준 설정 방법으로서 BRM의 효과에 대한 기존의 가정은 긍정적으로 왜곡된 집단(Pell 외. 2010; McKinley와 Norcini 2014), 즉 대다수의 학생이 '유능-우수' 능력 범위에 속하는 대규모 응시자 코호트의 고위험도 데이터를 통해 정보를 얻는 경향이 있었습니다. 세 가지 상황 각각에서 우리는 BRM이 대부분의 스테이션에서 방어 가능한 표준을 제공할 수 있다는 증거를 제공했습니다. 그렇지 않은 경우, 이는 일반적으로 글로벌 성적과 체크리스트/도메인 점수 간의 관계가 좋지 않아 BRM 표준에 의문을 제기하기 때문입니다(Pell 외. 2010). 이 문제는 후보 점수가 충분히 분산되지 않아서 발생하는 경우가 많으며(예: 그림 1), 소규모 코호트의 경우 대규모 코호트에 비해 '제한된 범위'의 점수가 나올 위험이 분명히 더 큽니다. 이러한 가설에도 불구하고, 세 가지 상황 모두에서 이러한 위험의 유병률은 특별히 높지 않았으며, 이는 아마도 우수한 OSCE 시험장(및 채점) 설계와 응시자의 관찰된 성과에 대한 평가자의 글로벌 판단 능력(및 이에 대한 지원)의 상호작용을 반영하는 것일 수 있습니다.
Existing assumptions about the effectiveness of BRM as a standard setting method have tended to be informed by high stakes data from larger cohorts of candidates from a positively skewed population (Pell et al. 2010; McKinley and Norcini 2014) – namely, where the vast majority of students occupy a ‘competent-excellent’ range of ability. In each of our three contexts, we have provided evidence that BRM can deliver defensible standards in the majority of stations. Where this is not the case, this is usually because of a poor relationship between global grades and checklist/domain scores that brings into question the BRM standard (Pell et al. 2010). This problem is often brought about by a lack of sufficient spread in candidate scores (e.g. Figure 1), and for small cohorts, the risk of a ‘restricted range’ of scoring is obviously more likely compared to larger cohorts. Despite this hypothesis, the prevalence of this was not particularly high across any of the three contexts, perhaps reflecting the interplay of good OSCE station (and scoring) design and the ability of (and support for) assessors global judgments about observed performance of candidates.
이 시험은 상대적으로 높은 불합격률(일반적으로 스테이션 수준에서 26%)로 인해 코호트 내에서 점수가 더 가변적이라는 것을 나타내며, 이는 기술적 관점에서 BRM이 효과적으로 작동할 가능성이 더 높은 특성입니다(Draper and Smith 1998, 3장). 순차적 맥락에서 실패율은 일반적으로 더 낮으며(역의 실패율 중앙값은 18% 정도), PA 검사의 경우 이보다 더 낮습니다(≈12%). 우리의 분석은 실제로 이 가설을 부분적으로 확인시켜 주었으며, PLAB2 스테이션의 일부(≈5%)만이 BRM 적용에 문제가 있는 반면, 다른 두 컨텍스트에서는 BRM의 문제 유병률이 조금 더 높았습니다(시퀀스 2의 경우 14%, PA의 경우 12%). BRM에 따른 점수/등급(및 응시자 능력)의 확산 문제와 표준에 미치는 영향(및 이와 관련된 오류)은 더 많은 연구가 필요한 분야이지만, 우리의 연구에 따르면 BRM은 응시자 능력의 확산이 제한적인 일부 소규모 코호트 평가 형식 시험(예: 고도로 전문화된 대학원 시험)에는 여전히 적합하지 않을 수 있습니다.
One might hypothesize that BRM standard setting should ‘work’ better in PLAB2 compared to the other contexts, since this exam has a relatively high failure rate (typically 26% at the station level) which indicates that scores are more variable within the cohort – a characteristic that, from a technical point of view, makes BRM more likely to function effectively (Draper and Smith 1998, chap. 3). The failure rates in the sequential context are generally lower (median failure rate in station of the order of 18%), and for the PA examinations are lower still (≈12%). Our analysis does indeed partially confirm this hypothesis, with only a small proportion (≈5%) of PLAB2 stations being problematic for the application of BRM, whereas the prevalence of issues with BRM is a little higher in the other two contexts (14% for sequence 2, and 12% for PA). The issue of spread of marks/grades (and candidate ability) and the impact on standards (and error associated with this) under BRM is an area that requires more research but our work might indicate that BRM remains unsuited to some small cohort assessment formats testing where there is a limited spread of candidate ability (e.g. highly specialized postgraduate examinations).
평가자 엄격성 및 평가 설계
Assessor stringency and assessment design
세 가지 상황과 대규모 코호트 시험의 중요한 차이점 중 하나는 전자의 경우 병렬 회로가 없다는 것입니다(Harden 외. 2015, 6장). 즉, 세 가지 상황에서는 각 스테이션에 해당하는 평가자가 (보통) 한 명인 반면, 대규모 의과대학의 경우 병렬 회로가 20개 이상일 수 있으므로 각 스테이션은 많은 수의 개별 평가자가 평가하게 됩니다. 어떤 의미에서는 한 명의 평가자가 모든 응시자를 시험 전반에 걸쳐 동일한 평가자가 관찰하기 때문에 스테이션 채점에 일관성을 가져올 가능성이 더 높습니다. 반면, 소규모 코호트에서는 단일 평가자가 스테이션과 혼동될 수 있으며 스테이션 수준에서 평가자의 엄격성을 직접 비교할 수 있는 쉬운 방법이 없습니다(Pell 외. 2010; Yeates 외. 2019). 또한, 여러 서킷에 걸쳐 여러 평가자가 아닌 스테이션당 한 명의 평가자가 존재할 경우 동일한 스테이션을 모두 심사하는 동료 그룹에 비해 보정이 부족할 수 있습니다. 이 문제와 관련하여 Crossley 외(2019)의 최근 연구에서는 평가자가 변화에 대한 개방성과 개인적 판단에 대한 충실성 사이에서 균형을 잡는 '경계된 호기심'(동료의 비교 판단), 정서적 편향, '적당한 보수주의'의 복잡한 균형에 대해 설명합니다.
One important difference between our three contexts and larger cohort exams is the lack of parallel circuits in the former (Harden et al. 2015, chap. 6). In other words, there is (usually) a single assessor corresponding to each station in our three contexts, whereas in a large undergraduate medical school, for example, there might be of the order of 20 or more parallel circuits, so that each station is assessed by a large number of individual assessors. In one sense, having a single assessor is more likely to bring consistency to the marking of the station since all candidates will be observed by the same set of assessors across the exam. On the other hand, in small cohorts, single assessors are confounded with stations and there is no easy way to directly compare assessor stringency at the station level (Pell et al. 2010; Yeates et al. 2019). The presence of a single assessor per station (rather than multiple across circuits) may also contribute to a lack of calibration compared to a group of peers all examining the same station. Pertinent to this issue, recent work by Crossley et al. (2019) describes a complex balance of ‘guarded curiosity’ (of comparative judgments by peers), affective bias and ‘moderated conservatism’ where assessors balance openness to change alongside loyalty to personal judgments.
이 주제를 좀 더 자세히 살펴보면, 평가자의 점수 엄격성(즉, '매와 비둘기')이 소규모 코호트에서 BRM 표준에 미치는 영향이 더 클 수 있습니다(Yeates and Sebok-Syer 2017). '관대한' 채점을 사용하면 점수가 분산형 다이어그램의 오른쪽 상단 모서리에 위치하는 경향이 있으며(그림 1 참조), 이는 회귀선을 통해 경계선 등급으로 다시 추정할 때 '정확한' 컷 점수에 상당한 불확실성이 있다는 것을 의미합니다. 이 문제는 마커가 더 엄격하면 점수가 경계선 등급에 가까워지고 외삽의 정도, 따라서 '오차'가 상대적으로 작아질 가능성이 높기 때문에 덜 심각할 수 있습니다. 이와 관련이 있지만 직관적이지 않을 수 있는 점은 덜 엄격한 평가자가 실제로 BRM에서 컷 점수를 높일 수 있다는 점입니다. 그림 1에 표시된 비뇨기 스테이션의 투여는 데이터 세트에서 동일한 스테이션의 22개 투여 중 컷 점수가 가장 높지만 평가자는 상대적으로 높은 점수를 부여하고 있으며 평가자 엄격도 척도의 비둘기파 쪽에 속할 가능성이 높습니다. 이러한 문제는 분명 복잡하며, 소규모 코호트 시험에서 평가자 선정 및 교육과 관련하여 더 많은 사고를 도울 수 있는 통계적 시뮬레이션 방법(Currie and Cleland 2016; Homer 외. 2016)을 사용하여 추가 조사를 하는 것이 도움이 될 수 있습니다.
Exploring this theme further, the impact of assessor scoring stringency (i.e. ‘hawks and doves’) (Yeates and Sebok-Syer 2017) is likely to be greater on BRM standards in small cohorts. With ‘generous’ markers, the scores will tend to be in the top right corner of the scatter diagram (see Figure 1) and this means that there is considerable uncertainty in the ‘correct’ cut-score when extrapolating back towards the borderline grade via the regression line. This issue is perhaps less acute with stricter markers as then the scores will be near the borderline grade and the degree of extrapolation, and hence the ‘error’, is, therefore, likely to be smaller in comparison. A related, but perhaps, counter-intuitive point is that less stringent assessors might actually raise the cut-score under BRM – the administration of the urinary station shown in Figure 1 has the highest cut-score out of the 22 administration of the same station in the dataset, and yet the assessor is giving relatively high scores and is likely to be on the dovish end of the assessor stringency scale. Clearly, these issues are complex and would benefit from further investigation, perhaps using statistical simulation methods (Currie and Cleland 2016; Homer et al. 2016), which could aid further thinking with regard to the selection and training of assessors in small cohort exams.
설계 문제에 관한 마지막 의견은 글로벌 성적에 대한 평가 척도의 성격과 관련이 있습니다. 예를 들어 상황에 따라 4점 또는 5점 척도가 더 적절한지, 소규모 코호트에서는 더 짧은 척도를 선호할 수 있는지를 조사하기 위해서는 더 많은 연구가 필요합니다. 한 가지 권장 사항은 응시자 풀의 능력 프로필을 광범위하게 반영하여 평가자가 실제로 모든 성적을 사용할 가능성을 높이는 것입니다. 교수진은 평가 척도를 작성하기 위해 '안전'의 양쪽에서 볼 수 있는 성과 범위를 개념화해야 하며, 이 과정을 정기적으로 검토할 수 있습니다. 세 가지 상황 모두에서 이 척도는 여러 개의 합격 등급과 하나의 불합격 등급으로 구성된 비대칭형입니다. 저희가 아는 한, BRM에 따라 다르게 구성된 글로벌 평가 척도의 효율성을 비교한 연구는 아직 발표되지 않았습니다.
A final comment concerning design issues relate to the nature of the rating scale for the global grade. More research is needed to investigate whether, for example, four or five-point scales are more appropriate depending on the context – and perhaps in small cohorts the evidence might favour a shorter scale. One thing we recommend is that the scale broadly reflects the ability profile of the candidate pool – thereby making it more likely that all grades are actually used by assessors. Faculty should conceptualize the range of performances that are seen, either side of just ‘safe’ to produce the rating scale, and this process can be reviewed regularly. In all three of our contexts the scale is asymmetric, with multiple passing grades and a single fail grade. To our knowledge, there is no published work comparing the efficacy of differently constructed global rating scales under BRM.
다른 표준 설정 접근 방식과의 비교
Comparisons with other standard setting approaches
일반적으로 저희는 스테이션 설계 요소, 현재 의료 관행, 평가자 교육 표준이 지속적으로 발전하고 있는 이전 시행의 데이터에서 파생된 표준보다는 실제 시험의 데이터를 사용하여 설정된 표준을 선호합니다. 이러한 모든 요소를 점수/등급 부여 패턴에 충분히 고려하고 그에 따라 기준을 설정할 수 있는 것은 현 행정부에서만 가능합니다. 그러나 6번의 순차적 시험 시행을 분석한 결과, 시험 대상인 소규모 코호트에서 직접 도출한 2단계 스테이션의 BRM 도출 표준과 대규모 코호트에서 도출한 동일한 스테이션의 표준(예: 1단계의 일부로 설계된 경우)에는 약간의 차이가 있는 것으로 나타났습니다. 이는 분명히 중요한 문제이며, 이러한 차이가 소규모 코호트와 대규모 코호트 간 평가자 행동의 실질적이고 체계적인 변화의 결과인지 더 잘 이해하기 위해 추가 조사가 필요합니다. 시퀀스 2 시험에서 학생들은 정의상 더 약한 하위 그룹에 속하며, 평가자가 어느 정도는 시퀀스 1 시험보다 더 높은 지분을 가진 것으로 인식할 수 있습니다. 이러한 지식이 평가자가 제공하는 채점에 영향을 미칠 수 있나요?
As a general principle, we prefer standards set using data from the actual examination, rather than that derived from data from previous administrations – elements of station design, current medical practice, and standards of assessor training are constantly developing. It is only in the current administration that all these factors can be taken into account fully in the pattern of scores/grades awarded, and the standard thereby set. However, analysis of six sequential test administrations has shown small differences in the BRM derived standards of Sequence 2 stations when derived directly from the small cohort examined versus those from that same stations derived from larger cohorts (e.g. when blueprinted as part of Sequence 1). This is clearly an important issue and merits further investigation to better understand whether these differences are the result of substantive, systematic changes in assessor behaviour between small and large cohorts. In the sequence 2 examination, the students are by definition a weaker sub-group, and to an extent, the stakes may be perceived by assessors to be higher than they are in the sequence 1 examination. Might this knowledge influence the marking that assessors provide?
PA 시험에서 우리는 평가자가 앙고프 점수를 제공할 때 극단적인 점수를 피하는 경향이 있음을 보았습니다(BRM에서는 이 문제가 훨씬 덜함). 이는 평가자가 전체 척도를 사용하는 것을 꺼리는 작업장 기반 평가에서 잘 알려진 문제의 반향을 담고 있습니다(Crossley and Jolly 2012). 선험적 표준 설정 회의에서 이러한 꺼려하는 것으로 추정되는 사회적 이유도 있을 수 있지만(Fitzpatrick 1989), 현재 연구에는 이 문제에 대해 언급할 만한 데이터가 없습니다.
In the PA exam, we have seen that assessors tend to shy away from extremes when providing their Angoff scores (and that this is far less of a problem with BRM) – this carries an echo of the well-known issue in workplace-based assessment where there is a reluctance for assessors to use the full scale (Crossley and Jolly 2012). There may also be social reasons for this presumed reluctance in an a priori standard setting meeting (Fitzpatrick 1989) but the current study has no data to speak to this issue.
결론
Conclusions
이 연구는 기존의 가정에 도전하고 비교적 간단한 방법(예: 분산 그래프의 육안 검사 및 R-제곱 값 계산)을 사용하여 소규모 코호트의 맥락에서 BRM을 사용하는 것이 일반적으로 성공적일 수 있음을 보여주었습니다. 이 논문에서는 회귀 기반 접근법의 견고성을 판단하기 위한 보다 기술적 접근법(예: 견고한 회귀, 베이지안 방법 또는 보다 정교한 모델링 접근법)은 피했지만, 이러한 접근법은 향후에 추가로 적용할 가치가 있을 것입니다(Wilcox 2012, 10장; Tavakol 외. 2018). 정기적으로 사용되는 스테이션의 표준이 정확히 무엇을 의미하는지에 대한 철학적 문제도 있지만, 예를 들어 해당 날짜의 표준인지 아니면 이전 시행의 모든 데이터를 사용하여 표준을 도출해야 하는지에 대해서는 이 논문의 범위를 넘어서는 철학적 문제도 있습니다.
Challenging established assumptions, and using relatively simple methods (e.g. visual inspection of scatter graphs and calculation of R-squared values), this study has shown that the use of BRM in the context of the small cohorts can be generally successful. We have avoided in this paper more technical approaches to judging robustness of regression-based approaches (e.g. robust regression, Bayesian methods, or more sophisticated modelling approaches) but these might well merit further application in the future (Wilcox 2012, chap. 10; Tavakol et al. 2018). There are also philosophical issues that are worthy of further consideration, but beyond the scope of this paper, regarding what exactly we mean by the standard for a station that is used regularly – for example, is it the standard on the day in question, or should we use all data from previous administrations to derive the standard?
그러나 실용적인 관점에서 볼 때, 가급적이면 이전에 만족스러운 스테이션 성과를 기반으로 한 기존 컷 점수가 소규모 코호트 시험의 모든 스테이션에 이상적으로 제공되어야, BRM에 문제가 발생했을 때(예: 점수 확산 부족) 스테이션을 제거할 필요 없이 이 컷 점수가 대체할 수 있습니다. 저희는 지표가 좋지 않다는 것은 스테이션에 문제가 있다는 것을 의미할 수 있음을 잘 알고 있습니다(예: 설계 문제, 예상 성능 수준에 대한 이해 부족, 평가자 교육 문제). 간결성의 원칙과 청사진을 유지해야 할 필요성에 따라 점수가 명백히 잘못되지 않는 한 시험에서 해당 스테이션을 제거하지 않는 것이 좋습니다. 그러나 이러한 스테이션은 문제의 원인을 더 잘 이해하기 위해 시험 후 검토를 위해 플래그를 지정해야 합니다.
However, from a practical point of view, extant cut-scores, preferably based on previous satisfactory station performance (Pell et al. 2010), should ideally be available for all stations in small cohort exams so that when problems with BRM do occur (e.g. a lack of spread of scores) these cut-scores can substitute without the need for the removal of the stations. We recognize that poor metrics might well indicate that there is a problem in the station (e.g. a design issue, or a lack of understanding of expected level of performance, or an assessor training issue). The principle of parsimony and the need to maintain the blueprint would suggest not removing the station from the exam unless scores are clearly erroneous. However, such stations should be flagged for post-examination review to better understand the causes of the problems.
사후 분석에 따라 BRM에 문제가 있는 것으로 판명되는 드문 경우를 대비하여 대규모 코호트에서는 '백업' 컷 점수가 어느 정도 필요하다고 주장할 수도 있지만, 그 자체가 청사진 작성 과정의 품질과 궁극적으로 평가의 타당성을 위협하는 저조한 스테이션을 제거하는 것에 만족하지 않는 한 그렇지 않습니다(Downing and Haladyna 2004).
One could argue that the need for ‘backup’ cut-scores might also be true to an extent for larger cohorts for the rare occasions when BRM proves problematic based on post hoc analysis – unless one is happy with removing poorly performing stations which itself threatens the quality of blueprinting process and ultimately the validity of the assessment (Downing and Haladyna 2004).
모든 고품질 평가 도구의 개발 및 사용과 마찬가지로, 우리는 마지막으로 평가의 목적과 평가 결과에서 도출할 추론에 대한 명확한 표현을 기반으로 스테이션 수준 채점 도구(예: 글로벌 평가 척도, 주요 기능 체크리스트 또는 도메인 채점 척도)의 전반적인 설계에 항상 주의를 기울여야 한다는 점을 언급합니다(Kane 2013). BRM을 효과적으로 사용하려면 적절한 코호트 규모를 고려해야 하지만, 피검자의 이질성 정도, 양호한 시험장 설계, 만족스러운 평가자 교육 및 행동 등 다양한 다른 요인에 따라 달라질 수 있습니다.
As with all development and use of high quality assessment tools, we comment finally that care always needs to be taken in the overall design of station level scoring instruments (i.e. global rating scales, and key features checklists or domain scoring scales) based on clear articulation of the purpose(s) of the assessment and the inferences to be drawn from its outcomes (Kane 2013). Whilst the effective use of BRM should include consideration of adequate cohort size, it is also contingent on a range of other factors including the degree of examinee heterogeneity, good station design, and satisfactory assessor training and behaviour.
Setting defensible standards in small cohort OSCEs: Understanding better when borderline regression can 'work'
PMID: 31657266
DOI: 10.1080/0142159X.2019.1681388
Free article
Abstract
Introduction: Borderline regression (BRM) is considered problematic in small cohort OSCEs (e.g. n < 50), with institutions often relying on item-centred standard setting approaches which can be resource intensive and lack defensibility in performance tests.Methods: Through an analysis of post-hoc station- and test-level metrics, we investigate the application of BRM in three different small-cohort OSCE contexts: the exam for international medical graduates wanting to practice in the UK, senior sequential undergraduate exams, and Physician associates exams in a large UK medical school.Results: We find that BRM provides robust metrics and concomitantly defensible cut scores in the majority of stations (percentage of problematic stations 5, 14, and 12%, respectively across our three contexts). Where problems occur, this is generally due to an insufficiently strong relationship between global grades and checklist scores to be confident in the standard set by BRM in these stations.Conclusion: This work challenges previous assumptions about the application of BRM in small test cohorts. Where there is sufficient spread of ability, BRM will generally provide defensible standards, assuming careful design of station-level scoring instruments. However, extant station cut-scores are preferred as a substitute where BRM standard setting problems do occur.
'Articles (Medical Education) > 평가법 (Portfolio 등)' 카테고리의 다른 글
| 평가에 대한 메타포의 사용과 남용(Adv Health Sci Educ Theory Pract. 2023) (0) | 2023.11.05 |
|---|---|
| 사회문화적 학습이론과 학습을 위한 평가 (Med Educ, 2023) (0) | 2023.11.05 |
| OSCE를 위한 자원 효율적이고 신뢰할 수 있는 합격선 설정 방법: 표준화 환자를 단독 평가자로 하는 경계선 회귀 방법(Med Teach, 2022) (0) | 2023.09.08 |
| OSCE에서 경계선 집단 방법과 경계선 회귀 방법을 기준-기반 합격선 설정과 비교(J Educ Eval Health Prof. 2021) (0) | 2023.09.08 |
| OSCE 합격선 설정: 세 가지 경계선 집단 방법(Medical Science Educator, 2022) (0) | 2023.09.08 |