OSCE 합격선 설정: 세 가지 경계선 집단 방법(Medical Science Educator, 2022)
OSCE Standard Setting: Three Borderline Group Methods
Sydney Smee2 · Karen Coetzee1 · Ilona Bartman2 · Marguerite Roy3 · Sandra Monteiro4

소개
Introduction
표준 설정 시험에서 "경계선"으로 평가된 수험생은 전문 표준을 명확하게 충족한 수험생과 그렇지 않은 수험생을 구분하는 중요한 점수 범위를 나타내며, 어떤 "경계선" 수험생이 표준을 충족했는지를 파악하는 것이 과제입니다. 객관적 구조화 임상시험(OSCE)의 데이터로 커트라인 점수를 계산하기 위해 다양한 경계선 그룹 방법이 도입되었습니다[1,2,3,4,5,6]. 수정된 BGM은 사용 편의성을 최우선으로 고려했습니다[4]. 일반적으로 경계선으로만 평가된 수험자의 평균 점수가 각 스테이션에 대해 계산됩니다. 그런 다음 스테이션 평균 점수를 평균하여 최종 OSCE 컷 점수를 얻습니다. 최종 결정은 시험관의 판단을 최대한 반영하여 실제 수행을 관찰한 결과를 바탕으로 이루어집니다. 따라서 별도의 표준 설정 패널이 필요하지 않아 컷 점수 설정에 드는 노력과 비용을 크게 줄일 수 있다는 장점이 있습니다[7,8,9,10,11]. 그러나 이 방법의 유용성에 대한 초기 증거는 대규모 국가 OSCE의 맥락에서 나온 것입니다. 각 시험장마다 여러 명의 시험관이 있었고 각 시험장의 경계선 코호트 규모가 컸습니다[4]. 시험관 편차가 전체 등급에 미치는 영향과 경계선 그룹에 속한 이상치 응시자의 영향은 평균화하여 역별 컷 점수에 미치는 영향을 최소화하거나 전혀 영향을 미치지 않았습니다. 소규모 단일 기관 OSCE의 경우, 경계선 코호트에서 시험관 분산과 이상치 응시자, 또는 심지어 OSCE 스테이션에 경계선 응시자가 거의 또는 전혀 없는 경우에도 컷 점수에 상당한 부정적 영향을 미칠 수 있습니다.
In standard-setting exercises, examinees rated as “borderline” represent a critical range of scores separating those that clearly met the professional standard and those that did not, the challenge being to determine which “borderline” examinees have also met the standard. A variety of borderline group methods have been introduced [1,2,3,4,5,6], for calculating cut scores with data from objective structured clinical exams (OSCE). The modified BGM places ease of use at the top of the list [4]. Typically the mean scores of examinees exclusively rated as borderline are calculated for each station. Then, the station mean scores are averaged to achieve a final OSCE cut score. The final decision is based on observations of actual performances, making the most of the judgment of the examiners. Consequently, another advantage is eliminating the need for a separate standard-setting panel, significantly reducing the effort and cost of setting a cut score [7,8,9,10,11]. However, early evidence of the method’s utility was in the context of a large-scale national OSCE. There were multiple examiners for each station and the borderline cohorts for each station were large [4]. The impact of examiner variance on the global ratings and the effect of outlier examinees in the borderline groups were averaged out with minimal to no impact on the station cut scores. For smaller, single institution OSCEs, examiner variance and outlier examinees in the borderline cohorts, or even having few to no borderline examinees identified for an OSCE station, can significantly and negatively impact the cut score.
본 연구는 수정된 BGM의 타당성을 유지하면서 소규모 코호트에서 수정된 BGM 사용의 위험을 완화할 수 있는 OSCE 컷 점수 설정 프로세스를 평가하기 위해 수행되었습니다. 이를 위해 이 연구에서는 회귀 기반 수정과 라쉬 기반 수정을 수정된 BGM과 비교하여 고려했습니다. 회귀 기반 경계선 그룹 방법(회귀 BGM)과 라쉬 기반 경계선 그룹 방법(라쉬 BGM)의 강점을 아래에서 자세히 설명합니다.
The present study was conducted to assess a process for setting an OSCE cut score that would mitigate the risks of using modified BGM with smaller cohorts while retaining the feasibility of modified BGM. To this end, this study considered a regression-based modification and Rasch-based modification in comparison to modified BGM. We expand on the strengths of both a regression-based borderline group method (regression BGM) and Rasch-based borderline group method (Rasch BGM) below.
회귀 BGM은 수정 BGM에서와 같이 경계선 수험생의 데이터뿐만 아니라 모든 수험생의 점수 데이터를 회귀 방정식에 사용하여 스테이션별 편차를 처리합니다. 회귀 BGM 표준 설정에서 각 시험장에 대한 선형 방정식은 각 수험생의 글로벌 등급을 독립 변수로, 관련 총 시험장 점수를 종속 변수로 사용하여 계산됩니다[5,6,7]. 그런 다음 경계선 표준을 나타내는 글로벌 등급(예: 5점 척도 3점)을 방정식에 삽입하여 스테이션별 컷 점수를 나타내는 해당 스테이션 점수를 예측합니다[5,6,7]. 데이터 그래프를 검토하고 회귀선에서 글로벌 점수와 스테이션 점수 사이의 교차점을 식별하여 이 작업을 수행할 수도 있습니다. 그런 다음 예측된 스테이션 컷 점수를 평균화하여 최종 OSCE 컷 점수를 결정합니다. 이 통계 분석은 일반적인 통계 소프트웨어 또는 스프레드시트를 사용하여 선형 회귀 분석을 스테이션 데이터에 적용하기만 하면 되기 때문에 매력적입니다 [5,6,7]. 회귀 BGM은 보건 교육에서 OSCE를 위한 최적의 선택으로 설명되어 왔으며[12], 여러 연구에서 OSCE 표준 설정 접근법에 대한 신뢰성이 입증되었습니다[13, 14]. 또한 회귀 BGM은 수정 BGM의 모든 장점을 포함하고 있습니다 [5]. 회귀 BGM은 경계선 등급 데이터뿐만 아니라 전체 등급의 모든 데이터를 사용함으로써 경계선 등급을 받은 수험생이 없더라도 스테이션 컷 점수를 설정할 수 있습니다. 그러나 수정된 BGM과 마찬가지로, 이 계산은 특히 스테이션당 시험관 수가 적은 경우 극단적인 시험관 평가에 여전히 취약합니다.
The regression BGM addresses variance from a station by using all the examinee score data in the regression equation, not just data from the borderline examinees, as is done in modified BGM. In a regression BGM standard setting, a linear equation for each station is calculated using the global rating for each examinee as the independent variable and the associated total station scores as the dependent variable [5,6,7]. The global rating that represents the borderline standard (e.g. three on a 5-point scale) is then inserted into the equation to predict a corresponding station score that represents the station-specific cut score [5,6,7]. This can also be accomplished by examining a graph of the data and identifying the point of intersection on the regression line, between the global and station scores. The predicted station cut scores are then averaged to determine the final OSCE cut score. This statistical analysis is appealing as regression BGM only requires the application of a linear regression analysis to the station data, using common statistical software or spreadsheets [5,6,7]. The regression BGM has been described as an optimal choice for OSCEs in health education [12] and its reliability for OSCE standard-setting approach has been upheld in several studies [13, 14]. Furthermore, regression BGM includes all the advantages of modified BGM [5]. By using all the data from the global rating, not just the borderline rating data, regression BGM is able to set station cut scores even if no examinees are rated as borderline. However, as with modified BGM, the calculations are still vulnerable to extreme examiner ratings, especially when the number of examiners per station is small.
라쉬 BGM은 수정 BGM과 회귀 BGM의 동일한 장점과 시험자 편차의 영향을 완화할 수 있는 가능성을 제공합니다. 특히 Stone 등[15]은 수험자, 시험관, 시험장 및 전체 글로벌 성과 점수를 포함하는 4면체 라쉬 모델 분석을 Facets 소프트웨어에서 개발했습니다. Stone 등[15]은 라쉬 BGM이 평가 대상에 대한 잘못 정의된 구성에 대한 수정된 BGM의 의존도를 바로잡는다고 주장합니다. 라쉬 BGM의 뛰어난 특징은 정성적 전문가 판단을 평가 대상의 구성을 정의하는 정량적 단일 선형 척도로 변환한다는 것입니다[16, 17]. 이 표준화된 척도를 사용하면 콘텐츠 난이도와 응시자 능력 간의 직접적인 점수 비교가 가능하며, 이 척도를 따라 컷 점수를 점수로 표시할 수 있습니다. 커트라인 점수는 능력 수준이 충분하다고 판단되고 필수 지식 또는 역량을 습득한 것으로 간주되는 지점을 척도 상에 표시합니다. 다면 라쉬 측정 모델은 수험자의 점수에 영향을 줄 수 있는 시험 요소, 즉 OSCE와 같은 수행 평가에서 시험관의 채점 행동과 같은 요소를 포함할 수 있습니다. 여러 측면을 포함하면 이러한 측면과 관련된 분산을 추정할 수 있으며 시험관 매개 평가를 위한 객관적인 표준 설정 방법의 개발이 가능해집니다. 시험관을 포함함으로써 모델은 엄격하거나 관대한 채점과 관련된 분산을 설명할 수 있었습니다. 글로벌 등급 패싯은 경계선 수험생과 관련 역 점수 간의 직접 점수 비교를 위한 추정치를 계산하는 데 사용되었습니다. Stone 등[15]은 라쉬 기반 컷 점수가 패널 기반 표준 설정 패널의 결과와 매우 유사한 결과를 산출하여 라쉬 BGM이 검사자 매개 평가를 위한 유효하고 자원 집약적이지 않은 표준 설정 대안임을 입증했다고 밝혔습니다.
The Rasch BGM offers the same advantages of both modified BGM and regression BGM, and the possibility of mitigating the impact of examiner variance. Specifically, Stone et al. [15] developed a four-facet Rasch model analysis in Facets software, which included examinees, examiners, stations, and the overall global performance score. Stone et al. [15] argue the Rasch BGM rectifies modified BGM’s reliance on a poorly defined construct of what is being assessed. The outstanding feature of Rasch BGM is the translation of qualitative expert judgments onto a quantitative single linear scale that defines the construct being assessed [16, 17]. Using this standardized scale, it is possible to make direct score comparisons between content difficulty and test-taker ability and to represent the cut score as a point along this scale. The cut score marks the point on the scale where ability level is judged sufficient and essential knowledge or competence is deemed to be mastered. The many-facet Rasch measurement model allows for the inclusion of test facets that may influence examinee scores; facets such as examiner scoring behaviour in performance assessments like an OSCE. The inclusion of multiple facets allows the variance associated with these facets to be estimated and makes the development of an objective standard-setting method for examiner-mediated assessments possible. Including examiners allowed the model to account for variance associated with stringent or lenient scoring. The global rating facet was used to calculate estimates for direct score comparisons between borderline examinees and their associated station scores. Stone et al. [15] found that the Rasch-based cut score produced results that were very similar to results from a panel-based standard-setting panel, thereby demonstrating that Rasch BGM was a valid and less resource-intensive standard-setting alternative for examiner-mediated assessments.
세 가지 경계선 그룹 방법의 공통적인 장점은 위에 언급된 연구에 열거되어 있습니다:
- (1) 기준 참조 컷 점수는 임상 전문가가 여러 번의 실제 수행을 직접 관찰하여 (비디오로 촬영된 소량의 샘플이나 가상 수행에 근거한 판단이 아니라) 달성되며,
- (2) 이미 OSCE에 참여하고 있는 시험관에게 의존함으로써 실현 가능성이 크게 향상되고,
- (3) 기본 소프트웨어를 사용하여 각 시행 후 컷 점수 계산이 신속하게 완료되며,
- (4) 비용, 시간 또는 노력 측면에서 컷 점수 설정과 관련된 자원이 적다는 점 등이 있습니다.
The common advantages of all three borderline group methods are enumerated in the studies referenced above:
- (1) a criterion-referenced cut score is achieved based on direct observation of multiple actual performances by clinical experts (rather than judgments based on a small sample of videotaped or hypothetical performances),
- (2) feasibility is significantly enhanced by reliance on examiners who are already part of the OSCE,
- (3) calculating the cut score is completed quickly after each administration using basic software, and
- (4) resources associated with setting the cut score are small, whether measured in terms of money, time, or effort.
저희의 의도는 시험관 및 기타 원치 않는 변수의 영향을 최소화하여 OSCE 표준 설정 결정에 더 나은 정보를 제공할 수 있는 가능성을 고려하여 더 일반적으로 사용되는 수정된 BGM 및 회귀 BGM과 비교하여 라쉬 BGM의 정확성을 설명하는 것이었습니다. 각 방법은 캐나다에서 실무 경험을 쌓고자 하는 국제적으로 훈련된 간호사를 평가하는 고난도 12개 스테이션 OSCE의 커트라인 점수를 설정하는 데 채택되었습니다.
Our intent was to describe the accuracy of the Rasch BGM, compared to the more commonly used modified BGM and the regression BGM, given its potential to minimize the impact of examiner and other unwanted variance with the goal of better informing OSCE standard-setting decisions. Each method was adopted to set the cut score for a high-stakes 12-station OSCE assessing internationally trained nurses seeking entry to practice in Canada.
자료 및 방법
Materials and Method
이 연구의 데이터는 캐나다 내 주정부 등록 절차의 일환으로 평가 프로그램을 이수한 112명의 국제 교육을 받은 간호사를 평가한 2016년 OSCE에서 얻었습니다. OSCE는 다양한 환자 인구 통계에 걸쳐 공통적이고 중요한 환자 프레젠테이션을 샘플링하는 12개 스테이션으로 구성되었습니다. 응시자는 각 스테이션을 11분 이내에 완료해야 했습니다.
Data for this study came from a 2016 OSCE that assessed 112 internationally educated nurses who completed an assessment program as part of a provincial registration process within Canada. The OSCE consisted of 12 stations that sampled common and important patient presentations across various patient demographics. Examinees were required to complete each station within 11 min.
모든 응시자는 연구 및 품질 관리 목적으로 데이터를 사용하는 데 동의했으며, 모든 보고서는 모든 개인 식별자를 제거한 집계 데이터만 사용한다는 데 동의했습니다. 맥마스터 대학교의 해밀턴 통합 연구위원회는 이 동의서에 따라 수행된 OSCE 연구(보고 포함)는 추가적인 윤리 검토가 면제되는 것으로 간주했습니다.
All the examinees consented to the use of their data for research and quality control purposes with the agreement that any reports would only use aggregate data with all personal identifiers removed. The Hamilton Integrated Research Board of McMaster University deemed OSCE research done under this consent agreement, including reporting, exempt from further ethics review.
성과는 주 간호대학에서 정의한 입문-실무 역량과 관련된 14개의 사전 정의된 역량을 사용하여 채점되었습니다.
- 지식 기반 실무에는 (1) 병력 및 데이터 수집, (2) 신체 사정, (3) 결과 분석 및 해석, (4) 우선순위 결정, (5) 간호 전략 실행, (6) 의사소통, (7) 고객과의 협력, (8) 의료팀과의 협력, (9) 간호 계획 개발, (10) 간호 평가 및 모니터링 등 10가지 역량이 포함되었습니다.
- 윤리적 실천의 경우 (1) 책임과 성실성, (2) 안전, (3) 옹호, (4) 법적 의무의 네 가지 역량이 있었습니다.
각 스테이션에서 이 중 10~12개의 역량을 평가했습니다. 수험생들은 4개의 트랙 중 하나에 배정되었으며, 같은 날 모두 세 개의 세션 중 하나에 배정되었습니다. 각 스테이션당 4명의 시험관이 배치되었으며, 각 시험관은 28개의 수행을 관찰하여 총 48명의 시험관이 참여했습니다.
Performance was scored using 14 predefined competencies related to entry-to-practice competencies defined by the provincial college of nurses.
- For knowledge-based practice, there were 10 competencies: (1) health history and data collection, (2) physical assessment, (3) analysis and interpretation of findings, (4) prioritization, (5) implementation of care strategies, (6) communication, (7) collaboration with the client, (8) collaboration with the health care team, (9) nursing care plan development, and (10) evaluation and monitoring of care.
- For ethical practice, there were four competencies: (1) responsibility and integrity, (2) safety, (3) advocacy, and (4) legal obligations.
Ten to 12 of these competencies were assessed in each station. The examinees were allocated to one of four tracks, as well as one of three sessions all conducted on the same day. There were four examiners per station, with each one observing 28 performances, for a total of 48 examiners.
시험관들은 현재 주 내에서 근무 중인 간호사들로 구성되었습니다. 이들은 OSCE에 대한 정보(기본 사항, 평가 대상 역량, 평가 지침 등)로 시작하여 태블릿 채점 및 시험 당일 물류에 대한 지침으로 구성된 공식 교육을 받았습니다. 또한 필기 내용에 대한 이해도를 보정하고 표준화하기 위한 소그룹 작업도 있었습니다. 마지막으로, 화상 회의와 후속 토론을 통해 대그룹 채점 연습이 진행되었습니다. 총 교육 시간은 이틀에 걸쳐 12시간이었습니다.
Examiners were registered nurses currently practicing within the province. They received formal training that began with information about the OSCE (i.e. fundamentals, competencies being assessed, and rating guidelines), followed by instructions on tablet scoring and exam day logistics. There was also small group work to calibrate and standardize their understanding of the written content. Finally, there was a large group scoring exercise using videotaped encounters and follow-up discussions. Total training time was 12 h spread over 2 days.
시험관들은 각 역량에 대해 동일한 5점 만점 평가 척도를 사용하여 배정된 스테이션 내에서 수험생의 수행을 채점했습니다. 평가 척도는 녹색(탁월한 성과), 파란색, 노란색, 주황색, 빨간색(긴급한 성과)의 색상으로 고정되었습니다. 시험관이 피시험자의 성과에 범주형 라벨을 부여하도록 장려하기 위해 숫자 대신 색상을 성과 수준을 나타내는 지표로 사용했습니다. 터치스톤 연구소에서 실시한 내부 품질 보증 조사에 따르면, 시험관들은 숫자 등급이 암시하는 정확성이나 등급이 수험생의 합격 또는 불합격 여부에 영향을 미치는 것과는 달리, 색상 등급이 성능에 더 집중하는 데 도움이 된다고 생각하여 색상 등급을 선호한다고 답했습니다. 이 척도에서 파란색은 앵커 점수 또는 시험 표준을 나타내며, 이는 수험생이 최근 캐나다 간호 프로그램을 졸업한 사람에게 기대되는 실무 진입 표준과 동등한 수준의 수행을 하고 있음을 의미합니다. 시험관은 이 표준에 약간 미달하는 점수에는 노란색을, 이보다 더 낮은 점수를 받은 수험생에게는 주황색을 할당하도록 훈련받았습니다. 이러한 색상 수준은 사후에 5(녹색)에서 1(빨간색)까지의 수치 점수로 변환되었습니다. 각 스테이션의 등급 척도 점수의 평균이 해당 스테이션에 대한 수험자의 점수입니다. 각 스테이션 점수의 평균은 각 수험자의 총 OSCE 점수입니다.
During the OSCE, examiners scored examinee performances within their assigned stations using the same 5-point global rating scale for each competency. The rating scales were anchored by colours ranging from green (exceptional performance), blue, yellow, orange, to red (emergent performance). Colours were used as indicators of performance level, instead of numbers, to encourage examiners to assign a categorical label to the examinee’s performance. Internal quality assurance inquiries conducted at Touchstone Institute indicated that examiners preferred a colour scale as they felt it helped them focus more on the performance, as opposed to the precision implied by a number rating, or whether their rating would be responsible for passing or failing the examinee. On this scale, blue represents the anchor score or test standard, meaning an examinee is performing at a level equivalent to the Entry to Practice Standard expected of a recent graduate of a Canadian nursing program. Examiners are trained to allocate yellow to a performance slightly below this standard and orange to an examinee who performs even further below this. These colour levels were converted to numerical scores ranging from 5 (green) to 1 (red) post hoc. The mean of the rating scale scores for each station was the examinee’s score for that station. The mean of the station scores was each examinee’s total OSCE score.
합격 기준은 해당 주 내에서 최근 간호사를 졸업한 사람들이 수용할 수 있는 성적을 획득하는 것으로 정의되었습니다. 각 스테이션에 대해 시험관들은 위에서 설명한 역량에 점수를 매기는 데 사용한 것과 동일한 5점 척도를 사용하여 각 수험자의 성과를 전반적으로 평가했습니다. 다음과 같은 지침이 제공되었습니다. "이 스테이션의 전반적인 성과에 근거하여, 최근 주 학사 간호 프로그램을 졸업한 졸업생과 비교한 수험생의 현재 역량 수준은 -입니다."입니다. 5점 만점에 3점(노란색)을 받으면 "경계선"에 해당하는 수행을 확인할 수 있습니다. 수정된 BGM과 회귀 BGM의 경우 스테이션 점수가 사용되었습니다. 라쉬 BGM의 경우, 스테이션 점수를 먼저 백분율로 변환했습니다. 모든 OSCE 컷 점수는 가장 가까운 정수로 반올림했습니다.
The standard for passing was defined as attaining a performance acceptable for recent nurse graduates within the province. For each station, examiners rated each examinee’s performance globally, using the same 5-point rating scale as used to score the competencies described above. The following guideline was provided, “Based on the overall performance for this station, the examinee’s current level of competence as compared to a recent graduate from a provincial baccalaureate nursing program is–”. A global rating of 3 (yellow) out of 5 identified performances that were “borderline”. For modified BGM and regression BGM, stations scores were used. For Rasch BGM, station scores were first converted to a percent. All the OSCE cut scores were rounded to the nearest whole number.
- 수정된 BGM의 경우, 경계선 수행능력의 평균 점수가 해당 스테이션의 컷 점수가 되고, 스테이션 컷 점수의 평균이 OSCE 컷 점수가 되었습니다. 계산은 스프레드시트에서 수행되었습니다.
For modified BGM, the mean score of the borderline performances became the cut score for the station and the average of the station cut scores became the OSCE cut score. The calculations were done in a spreadsheet. - 회귀 BGM의 경우, 각 수험생의 글로벌 등급을 독립변수로, 해당 스테이션 점수를 종속변수로 사용하여 12개 스테이션 각각에 대한 선형 방정식을 계산했습니다. 이러한 계산은 스프레드시트에서도 수행되었습니다. 각 방정식에서는 3등급의 경계선 등급을 사용하여 스테이션별 예상 컷 점수를 계산했습니다. 스테이션별 컷 점수의 평균을 계산하여 OSCE 컷 점수를 생성했습니다.
For regression BGM, a linear equation for each of the 12 stations was calculated using the global rating for each examinee as the independent variable and the corresponding station score as the dependent variable. These calculations were done in a spreadsheet as well. The borderline rating of three was used in each equation to calculate the predicted station-specific cut scores. The station cut scores were averaged to generate the OSCE cut score. - 라쉬 BGM의 경우, 백분율로 표시되는 점수[18,19,20,21]에 유용한 4면 B100 라쉬 모델을 Facets 소프트웨어[22] 내에서 생성하여 각 스테이션에 개별적으로 적용했습니다. 패싯 1은 수험생, 패싯 2는 시험관, 패싯 3은 스테이션의 전체 글로벌 성능 점수(1~5로 코딩), 패싯 4는 수험생의 스테이션 점수로 구성되었습니다.
For Rasch BGM, a four-facet B100 Rasch model, useful for scores expressed as percentages [18,19,20,21], was created within Facets software [22] and applied to each station separately. Facet One was examinees, Facet Two was examiner, Facet Three was the overall global performance score for the station, coded as 1 to 5, and Facet Four was examinees’ station scores.
단절되거나 분리된 하위 집합을 처리하기 위해 패싯 1(수험생)을 0에 고정하고 중심이 아닌 패싯 4(스테이션 점수)를 고정했습니다. 따라서 패싯 1은 각 수험자를 수험자 표준 셀의 대표로 취급하는 더미 변수로 나타났습니다[18]. 데이터가 Rasch 모델 사양에 어느 정도 부합하는지, 따라서 이 분석에 적합한지 확인하기 위해 소프트웨어 출력의 일부로 생성된 적합 평균 제곱(MnSq) 통계를 조사했습니다. 적합도 또는 정보 가중치 통계는 개인을 대상으로 하는 항목에 대한 응답 패턴에 더 민감하며 그 반대의 경우도 마찬가지이므로 일반적으로 모델 적합도 데이터를 결정할 때 적합도보다 더 유용한 것으로 간주됩니다[19]. 그 범위에 대해서는 종종 논란이 있지만, 우리는 0.50에서 1.50 사이의 인핏 MnSq 값을 "측정에 생산적"으로, 0.50 미만과 1.50에서 2.0 사이는 생산성은 떨어지지만 저하되지는 않는 것으로, 2.0 이상은 측정 시스템을 왜곡하는 것으로 채택했습니다[19, 20]. 또한 출력의 일부로 생성된 분리 신뢰도 지수 통계는 각 패싯에 포함된 요소 간의 분산 또는 이질성 수준을 나타냅니다. 이 통계는 0에서 1 사이의 범위를 사용하며, 1에 가까운 값은 요소 간의 분산 수준이 높음을 나타냅니다[21].
To deal with disconnected or disjointed subsets, we anchored Facet One (examinees) at 0 and non-centred Facet Four (station score). Facet One therefore represented a dummy variable which treated each examinee as a representative of their examiner-standard cell [18]. To determine the extent to which the data fit the Rasch model specifications and therefore its suitability for this analysis, we investigated the infit mean square (MnSq) fit statistics generated as part of the software output. Infit or information-weighted statistics are more sensitive to the pattern of responses to items targeted on the person and vice versa; they are therefore generally considered more useful than outfit in determining data to model fit [19]. Although the range is often disputed, we adopted infit MnSq values between 0.50 and 1.50 as “productive for measurement”, less than 0.50 and between 1.50 and 2.0 as less productive but not degrading, and greater than 2.0 as distorting the measurement system [19, 20]. The Reliability of Separation Index statistic, also generated as part of the output, provided an indication of the level of variance or heterogeneity between the elements included within each facet. This statistic adopts a range from 0 to 1, with values closer to 1 representing higher levels of variance between elements [21].
경계선 수험생의 공정 평균 점수는 각 스테이션의 커트라인 점수가 되었습니다. 각 측면의 공정 평균 점수는 원래 점수 지표를 사용하여 계산되었으며, 시험관 배정과 관련된 분산과 같은 맥락[18,19,20,21]을 고려한 관찰된 평균을 나타냅니다. 그런 다음 스테이션 컷 점수를 평균화하여 최종 Rasch BGM 컷 점수를 생성했습니다.
The fair averagescore for borderline examinees became the cut score for each station. The fair average score for each facet was calculated using the original score metric and represents the observed average, accounting for context [18,19,20,21], for instance, the variance associated with examiner assignment. The station cut scores were then averaged to generate the final Rasch BGM cut score.
알파 계수와 함께 OSCE에 대한 기술 통계가 계산되었습니다. 컷 점수와 합격률, 결정 정확도 및 일관성 지수도 BB-CLASS 소프트웨어[23,24,25]를 사용하여 계산했습니다. 항목별 총 상관관계 및 컷 점수와 함께 스테이션 수준의 설명 통계도 분석에 포함되었습니다. 회귀 분석의 스테이션 수준 결과도 제공됩니다.
Descriptive statistics for the OSCE, along with the alpha coefficient, were calculated. The cut scores and pass rates were also calculated, along with decision accuracy and consistency indices, which were generated using BB-CLASS software [23,24,25]. Station-level descriptive statistics along with item-total correlations and cut scores were included in the analysis. Station-level results from the regression analyses are also provided.
결과
Results
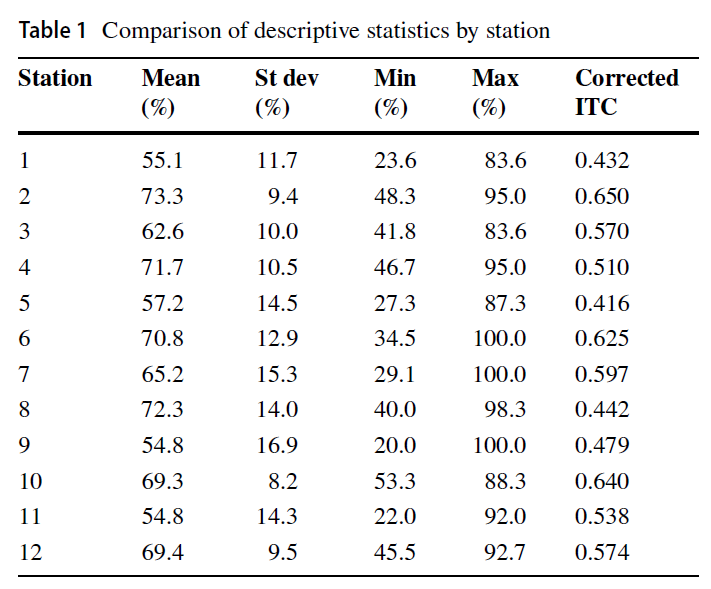
OSCE는 큰 문제 없이 시행되었습니다. 평균 점수는 64%, 표준 편차는 7.7%, 알파 계수는 0.85였습니다. 스테이션별 기술통계 결과는 평균 점수의 범위가 54.8~73.3%로 스테이션별 난이도의 범위를 보여줍니다. 모든 스테이션의 항목-총상관계수(ITC)는 0.20 이상으로 12개 스테이션에서 적절한 수준의 내부 일관성이 있음을 나타냅니다[24]. 스테이션에 대한 설명적 결과는 표 1에 나와 있습니다.
The OSCE was administered without any significant issues. The mean score was 64% with a standard deviation of 7.7% and an alpha coefficient of 0.85. Station-level descriptive results show a range in mean scores from 54.8 to 73.3%, illustrating a range in station difficulty. All stations had item-total correlations (ITC) greater than 0.20, indicating an adequate degree of internal consistency across the 12 stations [24]. The descriptive results for the stations are provided in Table 1.
전반적으로 데이터는 인핏 MnSq 통계에 의해 결정된 모델 사양에 충분히 부합했습니다. 구체적으로,
- 패싯 2(검사자)는 12개 스테이션에서 평균 1.34(범위: 0.94~1.93)의 인핏 MnSq 값을 달성했고,
- 패싯 3(글로벌 성능 점수)은 평균 1.28(범위: 0.55~2.11)을 달성했습니다. 패싯 3의 경우, 스테이션 8의 한 스테이션만이 측정 시스템을 왜곡하는 것으로 간주되는 값(2.11)을 달성하여 평가 품질 보증을 위해 추가 조사가 필요했으며, 본 연구 내에서 스테이션 8에 대한 조정은 이루어지지 않았습니다.
- 마지막으로, 패싯 4(스테이션 점수)는 1.31(범위: 0.95~1.79)의 평균 적합도 MnSq 값을 달성했습니다.
- 이 패싯은 더미 변수로 모델에 포함되었기 때문에 패싯 1(수험자)에 대한 적합도 통계는 생성되지 않았습니다.
Overall, the data achieved sufficient fit to model specifications as determined by infit MnSq statistics. Specifically,
- Facet Two (examiners) achieved a mean infit MnSq value of 1.34 (range: 0.94 to 1.93) across the 12 stations,
- Facet Three (global performance score) achieved a mean of 1.28 (range: 0.55 to 2.11). For Facet Three, only one station, namely Station 8, achieved a value considered distorting to the measurement system (2.11) and warranted further investigation for assessment quality assurance purposes; no adjustments were made to Station 8 within this study.
- Lastly, Facet Four (station score) achieved a mean infit MnSq value of 1.31 (range: 0.95 to 1.79).
- Note, fit statistics were not generated for Facet One (examinees), as this facet was included in the model as a dummy variable.
패싯 2와 패싯 3에 각각 표시된 수험자 및 글로벌 성과 점수 요소에 걸쳐, 결과는 수험자 간에는 중간에서 높은 수준의 분산이, 글로벌 성과 점수 간에는 높은 수준의 분산이 나타났습니다. 특히 시험관의 경우, 평균 분리 신뢰도 지수는 0.64(범위: 0.18~0.94)로, 일부 시험소의 경우 시험관의 채점 행동에 상당한 차이가 있음을 나타냅니다. 전체 수행 점수 간의 차이 측면에서, 3번 영역의 분리 신뢰도는 12개 스테이션에서 평균 0.96(범위: 0.88~0.99)을 기록했으며, 이는 시험관이 이 점수를 사용하여 각 스테이션에서 응시자 간의 전반적인 수행 수준을 적절하게 식별했음을 나타냅니다.
Across the examiner and global performance score elements represented in Facet Two and Facet Three, respectively, results showed moderate to high levels of variance across examiners, and high levels of variance across global performance scores. Specifically for examiners, a mean Reliability of Separation Index of 0.64 (range: 0.18 to 0.94) was achieved, indicating that for some stations, examiners displayed significant differences in their scoring behaviour. In terms of differences between global performance scores, Reliability of Separation for Facet Three achieved a mean of 0.96 (range 0.88 to 0.99) across the 12 stations, indicating that examiners used these scores to appropriately identify distinct overall levels of performance between examinees in each station.
세 가지 방법으로 생성된 컷 점수는 거의 비슷했으며(범위 64-65%), 회귀 BGM과 라쉬 BGM 컷 점수는 동일한 값(65%)으로 반올림되었습니다. BB-CLASS 분석[23, 24]에서는 의사 결정 일관성과 의사 결정 정확도 지표를 제공했습니다. 결정 일관성은 반복 테스트에서 동일한 합격/불합격 결정을 내릴 가능성이 얼마나 되는지를 나타내며, 결정 정확성은 다른 측정치와 비교하여 동일한 결과를 얻을 가능성이 얼마나 되는지를 나타냅니다[24]. 세 가지 컷 점수는 모두 0.82 이상의 지수로 허용 가능한 일관성과 정확성을 보였으며, 이는 의사 결정에 대한 위양성과 위음성의 위험을 충분히 최소화한다는 것을 의미합니다. 표 2에는 세 가지 컷 점수에 대한 결과가 요약되어 있습니다.
The cut scores generated by the three methods were close (range 64–65%), with regression BGM and Rasch BGM cut scores rounding to the same value (65%). A BB-CLASS analysis [23, 24] provided decision consistency and decision accuracy indices. Decision consistency indicates how likely the same pass/fail decisions would be achieved on repeat testing while decision accuracy indicates how likely the same results would be achieved relative to other measures [24]. All three cut scores were acceptably consistent and accurate with indices ≥ 0.82, meaning they sufficiently minimized the risk of false positives and false negatives for decision-making. Table 2 summarizes the results for the three cut scores.
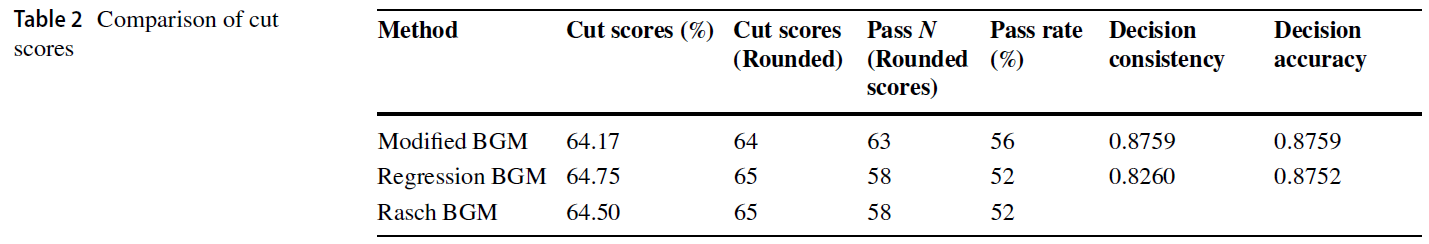
컷 점수의 작은 차이가 합격률에 영향을 미칠 수 있습니다. 표 2에서 볼 수 있듯이, 가장 높은 합격률(즉, 56%)은 수정된 BGM 컷 점수 64%에서 발생했습니다. 기준 설정 방식에 따라 합격률은 4%의 변동이 있었습니다.
Small differences in cut scores may impact pass rates. As shown in Table 2, the highest passing rate (i.e. 56%) was generated by the modified BGM cut score of 64%. Depending on the standard-setting method, the pass rate fluctuated by 4%.
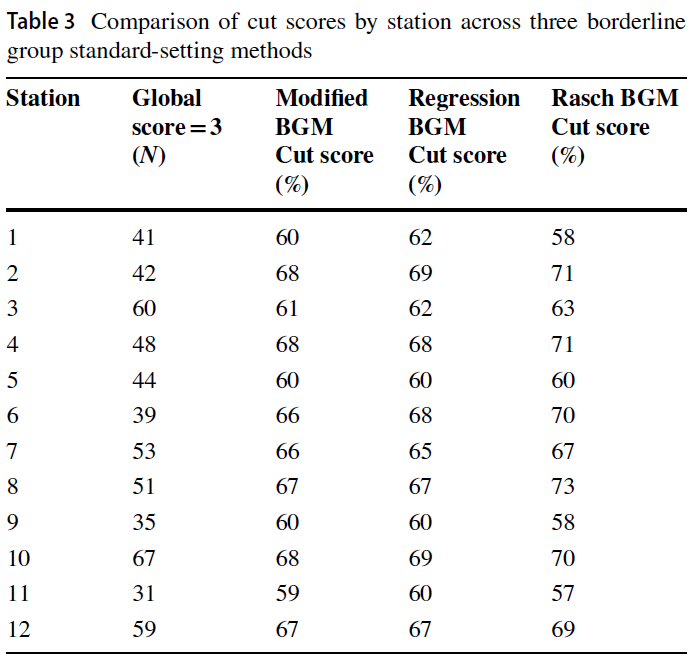
표 3은 각 스테이션의 경계선 그룹 크기와 각 방법 내 관련 컷 점수를 설명합니다. 각 스테이션별 경계선 그룹의 크기는 다양했지만 n = 31(코호트의 27.7%)에서 n = 67(59.8%)까지 모두 컸으며, 경계선 그룹이 n = 40(35.7%) 이하로 떨어진 경우는 단 3곳에 불과했습니다. 회귀 BGM과 라쉬 BGM 방법 모두 시험관의 경계선 판단을 사용하여 컷 점수를 설정했지만 전체 코호트의 점수와 함께 사용했습니다.
Table 3 describes the size of the borderline group in each station and the relevant cut score within each method. The size of the borderline group for each station varied but all were large, ranging from n = 31 (27.7% of the cohort) to n = 67 (59.8%), with only three borderline groups falling below n = 40 (35.7%). Both the regression BGM and Rasch BGM methods used the examiners’ borderline judgments to set the cut score but worked with the scores for the total cohort.
토론
Discussion
표준 설정은 궁극적으로 표준 설정 방법이 모범 사례를 반영하고 일관되게 따를 때 가장 방어할 수 있는 정책 결정입니다. 경계선 그룹 방법은 수험자 기반 및 기준 참조 방식이며 OSCE 형식과 잘 부합합니다. 이러한 방법에 대한 연구에 따르면 이러한 방법은 중대한 의사 결정을 지원하기에 충분히 타당하고 신뢰할 수 있는 것으로 입증되었습니다[5, 26, 27]. 또한 극단적인 시험관의 판단, 경계선에 있는 수험생 코호트가 작거나 존재하지 않는 경우, 시험장당 시험관이 소수이고 수험생 코호트가 작은 경우, 극단적인 수험생의 성적으로 인해 공정한 커트라인 점수를 설정할 때 발생할 수 있는 위험성을 강조한 연구도 있습니다[28].
Standard setting is ultimately a policy decision that is most defensible when the standard-setting method reflects best practice and is followed consistently. Borderline group methods are examinee-based and criterion-referenced and align well with the OSCE format. Studies of these methods have demonstrated that they are sufficiently valid and reliable to support high-stakes decision-making [5, 26, 27]. Studies have also highlighted the risks posed to setting a fair cut score introduced by the judgments of extreme examiners, small or non-existent cohorts of borderline examinees, and extreme examinee performances when there are only a few examiners per station and examinee cohorts are smaller [28].
이 연구 결과가 경계선 그룹 방법 중 한 가지를 다른 방법보다 명확하게 선호하지는 않았지만, 연구 결과에 따르면 수정된 BGM이 경계선 그룹 내 낮은 점수의 영향을 가장 많이 받아 가장 낮은 커트 점수로 이어지며, 이는 회귀 BGM 또는 라쉬 BGM 접근법 중 하나를 사용해야 한다는 주장을 뒷받침하는 약점이었습니다.
While the results of this study did not clearly favour one borderline group method over another, the findings did suggest that the modified BGM was the most influenced by lower scores within the borderline group, leading to the lowest cut score, a weakness that supports the arguments for using either of the regression BGM or Rasch BGM approaches.
스테이션 수준에서 모든 방법은 동일한 스테이션 5를 제외하고 스테이션 간에 서로 다른 컷 점수를 생성했습니다. 스테이션 간 차이는 평균을 내어 거의 동일한 총 컷 점수를 산출했으며, 라쉬 BGM과 회귀 BGM의 경우 동일한 값으로 반올림했습니다. 이 두 가지 방법이 이 코호트에서 거의 동일한 컷 점수를 생성했다는 사실은 놀라운 일이 아닙니다. 라쉬 BGM 방식은 기본적으로 시험자 편차를 고려한 후 회귀 BGM 방식입니다. 시험관 간 편차가 크면 각자의 컷 점수에 더 큰 차이가 있을 것입니다. OSCE 또는 기타 수행 평가를 위한 시험관 교육은 특히 수행을 평가하는 기준에 대한 공통된 이해를 증진하는 데 중요합니다. 시험관 선발 및 교육과 함께 트랙 차이를 최소화하기 위한 다른 전략이 효과적이라면 Rasch BGM에서 공정 평균을 계산할 때 조정이 최소화됩니다. 이 경우 조정이 적었기 때문에 컷 점수가 비슷했습니다. 그러나 OSCE 시험관 교육에 투입되는 시간과 노력은 잘 보고되지 않았으며 기관마다 크게 다릅니다. 개별 학교나 소규모 기관은 대규모 시험 설계 센터에서 실시하는 면허 시험 준비의 일상적인 부분인 시험관 교육에 투자할 충분한 자원이 없을 수 있습니다. 회귀 BGM보다 Rasch BGM을 사용하는 것의 가치는 문제가 되는 분산을 설명할 수 있다는 점입니다. 또한 두 방법 모두 모든 수험생 데이터를 사용했고 이 경우 시험장 점수 분포가 넓었기 때문에(표준편차 범위: 8.2~16.9%) 회귀선에 대한 극단적인 점수의 영향이 최소화되었고 데이터는 Rasch BGM에서 사용되는 공정 평균을 계산하는 데 좋은 근거를 제공했습니다.
At the station level, all methods generated different cut scores across stations, except for Station 5 which was identical. Differences between stations were averaged out to almost the same total cut score and rounded to the same value for Rasch BGM and regression BGM. The fact that these two methods generated almost the same cut score for this cohort is not surprising. The Rasch BGM method is basically the regression BGM method after taking into account examiner variance. With more variance between examiners, there would be a greater difference between their respective cut scores. Training examiners for an OSCE or any other performance assessment is important; in particular, to promote a common understanding of the standard against which performance is being judged. If examiner selection and training along with other strategies to minimize track differences are effective then the adjustments made when calculating the fair average in Rasch BGM are minimized. In this case, the adjustments were small and therefore cut scores were similar. However, the time and effort given to training OSCE examiners is not well reported and varies greatly across organizations. Individual schools or smaller institutions may not have sufficient resources to invest in examiner training, which is a routine part of OSCE preparation for licensing exams conducted by larger test design centres. The value of using Rasch BGM over regression BGM is its capacity to account for problematic variance. Furthermore, since both methods used all the examinee data and in this instance the station score distributions were broad (range of standard deviation: 8.2 to 16.9%), the impact of extreme scores on the regression line was minimized and the data provided a good basis for calculating the fair average used in Rasch BGM.
수정 BGM은 몇 가지 간단한 계산을 기반으로 가장 쉬운 방법이며, 커트라인 점수(64%)가 회귀 BGM 및 라쉬 BGM 방법(65%)과 거의 동일하지만, 수험자와 시험관 수가 적은 경우 여전히 가장 취약한 방법임에 틀림없습니다. 이번 OSCE에서는 12개 스테이션 모두에서 경계선 등급을 받은 수험생이 많았는데, 이는 적어도 부분적으로는 코호트의 이질성에 기인한 것으로 보입니다. 수험생들은 서로 다른 나라에서 훈련을 받았고 서로 다른 실무 배경을 가지고 있었습니다. 단일 간호 학교의 비슷한 규모의 코호트라면 훨씬 더 동질적일 것이며 경계선 그룹이 작거나 존재하지 않을 위험이 더 높을 것입니다.
While modified BGM remains the easiest based on a few simple calculations and despite a cut score (64%) almost identical to the regression BGM and Rasch BGM methods (65%), it is still arguably the most vulnerable method when examinee and examiner numbers are small. This OSCE had a good number of examinees rated as borderline for all 12 stations, which is at least partially attributable to the heterogeneity of the cohort. The examinees trained in different countries and came from different practice backgrounds. A similar-sized cohort from a single nursing school would be significantly more homogeneous and the risk of small or non-existent borderline groups would be higher.
회귀 BGM과 라쉬 BGM 모두 모든 수험자 데이터를 사용하여 경계선 그룹 내 극단적인 점수로 인한 편차를 상쇄했습니다. 회귀 BGM은 익숙한 방법인 단순 선형 회귀에 의존하고 계산도 쉽기 때문에 더 널리 사용되고 보고되었습니다.
Both regression BGM and Rasch BGM methods used all the examinee data to offset variance due to extreme scores within the borderline groups. Regression BGM has been more widely used and reported, likely because it relies on simple linear regression, a familiar method, and is also easily calculated.
4면 라쉬 모델은 공정 평균을 사용하여 스테이션 컷 점수를 설정함으로써 원치 않는 분산을 더 잘 분리하기 때문에, 라쉬 BGM이 더 방어력이 높다고 할 수 있습니다. 콘텐츠 난이도 대비 임상 능력을 정의하는 선형 척도를 따라 커트라인 점수를 배치하면 극단적인 점수, 시험관 편견 또는 경계선으로 평가되는 소수의 응시자의 영향에 덜 취약한 커트라인 점수를 얻을 수 있습니다. 하지만 이 방법을 적용하려면 어느 정도의 측정 전문 지식과 Facets 소프트웨어가 필요했습니다.
The Rasch BGM is arguably more defensible as the four-facet Rasch model better separates out unwanted variance by using the fair average to set station cut scores. Placing the cut score along a linear scale that defined clinical ability relative to content difficulty resulted in a cut score less vulnerable to the influence of extreme scores, examiner biases, or a small number of examinees being rated as borderline. However, some degree of measurement expertise and Facets software were required to apply this method.
Wood 등[4], Homer 등[29], Stone[15]이 주장한 바와 같이, 수정된 BGM은 여전히 학교 규모의 OSCE에서 가장 위험하며 소규모 OSCE의 경우 위험도가 증가합니다. 회귀 BGM과 라쉬 BGM은 모두 OSCE의 커트라인 점수를 설정하는 데 실행 가능하고 방어 가능한 옵션입니다. Stone 등[15]이 판사 매개 성능 평가에 라쉬 BGM을 사용했다고 보고한 것 외에는, 라쉬 BGM은 BGM과 회귀 BGM의 취약성을 모두 완화할 수 있는 잠재력에도 불구하고 OSCE에 사용하기 위해 검토되지 않았습니다. 표준 설정 방법은 퍼포먼스를 구분하지 않는 점수를 "고정"할 수는 없지만, 효율적인 BG 표준 설정 방법을 사용하면 채점 도구를 설계할 때 충분한 주의를 기울이는 데 사용할 수 있는 리소스를 확보할 수 있다는 이점이 있습니다.
The modified BGM is still the riskiest for school-sized OSCEs and the risk increases for smaller OSCEs, as argued by Wood et al. [4], Homer et al. [29], and Stone [15]. Both regression BGM and Rasch BGM are feasible and defensible options for setting a cut score for an OSCE. Aside from Stone et al. [15] reporting on the use of Rasch BGM for judge-mediated performance assessment, Rasch BGM has not been explored for use with OSCEs, despite its potential to mitigate the vulnerabilities of both BGM and regression BGM. Standard-setting methods cannot “fix” scores that do not differentiate between performances, but the benefit of using an efficient BG standard-setting method is that it frees up resources that can be used to ensure sufficient care is taken in designing the scoring instruments.
연구의 한계
Limitations of the Study
이 연구는 알파 계수가 높은 하나의 OSCE를 12개 스테이션에서 한 번 시행하고 모두 등급 척도로 채점하여 세 가지 방법을 경험적으로 비교한 것입니다. 이 OSCE의 높은 내적 일관성은 적어도 부분적으로는 평가 척도[30]의 사용과 수험자 코호트의 이질성 때문이라고 할 수 있습니다. 다양한 OSCE 설계(예: 체크리스트/평정 척도 조합을 사용한 채점), 보다 동질적인 수험자 코호트, 소규모 응시자 코호트를 통한 추가 탐색이 필요합니다. 하위 집합 간의 연결성은 수험자를 더미 변수로 포함시킴으로써 달성할 수 있습니다. 이상적으로 이러한 연결은 두 명 이상의 시험관이 동일한 성과에 대해 수험생을 채점하는 데이터 설계를 통해 달성할 수 있습니다.
This was an empirical comparison of three methods based on one administration of one OSCE with a high alpha coefficient, 12 stations, all scored with rating scales. The high internal consistency of this OSCE is due, at least in part, to the use of rating scales [30] and to the heterogeneity of the examinee cohort. Further exploration with different OSCE designs (e.g. scoring with checklist/rating scale combinations), more homogeneous examinee cohorts, and smaller candidate cohorts is needed. The connectedness between subsets was achieved by including the examinees as a dummy variable. Ideally this connection is achieved through a data design where examinees are scored by more than one examiner on the same performance.
결론
Conclusion
각 시험 양식마다 특정 사례의 난이도를 반영할 수 있도록 커트라인 점수를 설정해야 하며, 이는 실현 가능한 OSCE 표준 설정에 대한 주요 도전 과제입니다. 한 번의 시행에 사용되는 사례 집합인 각 OSCE 시험 양식은 사례가 다르다는 사실 외에는 다른 이유가 없다면 동일한 사례 은행에서 동일한 목적으로 만들어진 다른 시험 양식과 난이도 및 점수 분포가 다를 수 있습니다.
Cut scores need to be set for each test form to ensure that they reflect the difficulty of a specific set of cases, and therein lies a major challenge to feasible OSCE standard setting. Each OSCE test form, the set of cases used for one administration, will vary in its difficulty and in its score distribution from other test forms created for the same purpose from the same bank of cases, if for no other reason than the fact that cases are different.
시험 양식 간의 난이도 차이는 시험 양식을 동일하게 하거나 최소한 연결하여[31] 점수를 비슷한 분포로 변환함으로써 완화할 수 있습니다. 연계하면 연결된 시험 양식에 하나의 커트라인 점수를 적용할 수 있으며, 표준 설정 패널을 소집하는 데 드는 비용을 여러 번의 OSCE 시행에 걸쳐 분할 상각할 수 있습니다. 그러나 여러 시험 양식에 걸쳐 공통된 내용과 관련된 필수 가정을 충족하고 결과가 타당하고 신뢰할 수 있는지 확인하기 위한 심리측정 전문 지식을 갖추려면 리소스 집약적인 노력이 필요하며 대규모 사례 은행과 대규모 데이터 세트에서 가장 잘 작동할 수 있습니다.
Differences in difficulty across test forms can be mitigated with equating or at least linking test forms [31] which allows scores to be transformed to comparable distributions. With linking, one cut score can be applied across the linked test forms and the cost of convening standard-setting panels can be amortized over multiple OSCE administrations. However, meeting the necessary assumptions related to common content across test forms and having the psychometric expertise to ensure that the outcomes are valid and reliable are resource-intensive efforts and most workable with large case banks and large data sets.
연결하지 않는다면, 방어 가능한 커트라인 점수가 필요하기 때문에 각 시험 양식에 커트라인 점수를 설정하여 해당 사례 집합의 난이도를 고려해야 하며, 이 점에서 본 연구에서 검토한 표준 설정 방법의 근거가 있습니다. 단순히 정책적 결정으로 커트라인 점수를 설정하는 대안은 쉽고 비용이 저렴하지만 방어할 수 없습니다. 정책적으로 설정된 커트라인 점수는 시험 유형에 따른 난이도 차이를 고려하지 못하기 때문에 수험생에게 본질적으로 불공정한 결과를 초래합니다.
Without linking, the need for a defensible cut score requires that a cut score be set for each test form so that the difficulty of that set of cases is taken into account, and therein lies the rationale for the standard-setting methods examined in this study. The alternative of simply setting a cut score with a policy decision, while easy and inexpensive, is not defensible. Policy-set cut scores fail to account for the differences in difficulty across test forms, creating an inherent unfairness for examinees.
세 가지 경계선 그룹 방법의 목표는 모두 패널 기반 표준 설정에 대한 실현 가능한 대안이면서도 방어 가능한 커트라인 점수를 제공하는 것이었습니다. 이 연구 결과는 이전 연구 결과와 일치하며, 회귀 BGM이 매우 큰 편차와 매우 작은 편차 사이에 있는 OSCE의 경우 실현 가능하고 방어 가능한 표준 설정 방법이며, 특히 시험자 편차가 크게 문제가 될 수 있는 OSCE에서 고려할 만한 옵션으로 Rasch BGM을 추가한다는 추가적인 증거를 제공했습니다.
The goal of all three borderline group methods was a feasible alternative to panel-based standard setting that would still provide a defensible cut score. The results of this study were congruent with the findings of earlier studies and provided further evidence that for OSCEs that fall between being very large and very small, regression BGM is a feasible and defensible standard-setting method and adds Rasch BGM as an option worth considering, especially in OSCEs where examiner variance may be significantly problematic.
OSCE Standard Setting: Three Borderline Group Methods
PMID: 36532388
PMCID: PMC9755382 (available on 2023-12-01)
Abstract
High-stakes assessments must discriminate between examinees who are sufficiently competent to practice in the health professions and examinees who are not. In these settings, criterion-referenced standard-setting methods are strongly preferred over norm referenced methods. While there are many criterion-referenced options, few are feasible or cost effective for objective structured clinical examinations (OSCEs). The human and financial resources required to organize OSCEs alone are often significant, leaving little in an institution's budget for additional resource-intensive standard-setting methods. The modified borderline group method introduced by Dauphinee et al. for a large-scale, multi-site OSCE is a very feasible option but is not as defensible for smaller scale OSCEs. This study compared the modified borderline group method to two adaptations that address its limitations for smaller scale OSCEs while retaining its benefits, namely feasibility. We evaluated decision accuracy and consistency of calculated cut scores derived from (1) modified, (2) regression-based, and (3) 4-facet Rasch model borderline group methods. Data were from a 12-station OSCE that assessed 112 nurses for entry to practice in a Canadian context. The three cut scores (64-65%) all met acceptable standards of accuracy and consistency; however, the modified borderline group method was the most influenced by lower scores within the borderline group, leading to the lowest cut score. The two adaptations may be more defensible than modified BGM in the context of a smaller (n < 100-150) OSCE.
Keywords: Borderline group; OSCE; Standard setting; Validity.