질적 연구에서 주제 포화를 평가하고 보고하는 단순한 방법(PLOS ONE, 2020)
A simple method to assess and report thematic saturation in qualitative research
Greg Guest1, Emily NameyID2*, Mario Chen2

소개
Introduction
데이터 포화는 질적 표본 크기를 추정하고 평가하기 위한 개념적 척도입니다. 지난 20년 동안 학자들은 경험적 연구를 수행하고 특정 연구의 포화 상태에 도달하는 데 필요한 질적 인터뷰 수를 추정하기 위해 고안된 수학적/통계적 모델을 개발해 왔습니다. 이러한 연구는 질적 연구의 설계 단계에서 표본 크기 추정을 위한 근거 기반을 발전시켰지만, 데이터 수집 중 및/또는 수집 후에 포화와 표본 크기의 적절성을 결정하는 방법을 제공하지는 않습니다. 모스가 20여 년 전에 지적했듯이, "포화는 엄격성의 중요한 요소입니다. 이는 모든 질적 연구에 존재하지만, 안타깝게도 주로 선언을 통해 드러납니다."[1]. 이 백서에서는 질적 연구자가 단순한 선언을 넘어 포화에 대해 이야기하고 이에 대한 증거를 제시할 수 있도록 포화를 평가하고 보고하는 방법을 제시합니다.
Data saturation is the conceptual yardstick for estimating and assessing qualitative sample sizes. During the past two decades, scholars have conducted empirical research and developed mathematical/statistical models designed to estimate the likely number of qualitative interviews needed to reach saturation for a given study. Although this body of work has advanced the evidence base for sample size estimation during the design phase of a qualitative study, it does not provide a method to determine saturation, and the adequacy of sample sizes, during and/or after data collection. As Morse pointed out more than 20 years ago, “saturation is an important component of rigor. It is present in all qualitative research but, unfortunately, it is evident mainly by declaration” [1]. In this paper we present a method to assess and report on saturation that enables qualitative researchers to speak about--and provide some evidence for--saturation that goes beyond simple declaration.
이 접근법의 토대를 제공하기 위해 포화를 정의한 다음, 포화와 심층 인터뷰를 위한 표본 크기를 추정하는 지금까지의 작업을 검토합니다. 그 다음에는 포화를 운영 및 측정하기 위해 제시된 몇 가지 경험적 기반 방법에 대한 개요를 살펴보고 이러한 접근법을 실제 연구 맥락, 특히 귀납적 주제 분석을 사용하는 연구 맥락에 적용하는 데 따르는 어려움을 파악합니다. 그 후, 우리는 포화를 평가하는 대안적인 방법을 제안하고 귀납적 주제 분석 중 또는 분석 후에 포화를 평가하고 보고하는 비교적 사용하기 쉬운 방법을 제공합니다. 우리는 뚜렷하게 다른 세 가지 정성적 데이터 세트에 대해 부트스트래핑 기법을 사용하여 우리의 방법을 테스트하고 검증합니다.
To provide the foundation for this approach, we define saturation and then review the work to date on estimating saturation and sample sizes for in-depth interviews. We follow this with an overview of the few empirically-based methods that have been put forward to operationalize and measure saturation and identify challenges of applying these approaches to real-life research contexts, particularly those that use inductive thematic analyses. We subsequently propose an alternative way of evaluating saturation and offer a relatively easy-to-use method of assessing and reporting on it during or after an inductive thematic analysis. We test and validate our method using a bootstrapping technique on three distinctly different qualitative datasets.
우리가 제안하는 방법은 내러티브를 생성하는 것을 목표로 하는 정성적 데이터 수집 기법, 즉 귀납적 프로빙과 함께 개방형 질문을 사용하는 포커스 그룹 및 일대일 인터뷰를 위해 설계되었습니다(개별 인터뷰 데이터에 대해서만 이 방법을 검증하려고 시도했지만). 또한 귀납적 주제 분석[2-4]을 사용하여 데이터에서 새로운 주제를 발견한 다음 코드로 변환하는 상황에도 이 방법을 구체적으로 적용할 수 있습니다.
The method we propose is designed for qualitative data collection techniques that aim to generate narratives–i.e., focus groups and one-on-one interviews that use open-ended questioning with inductive probing (though we have only attempted to validate the method on individual interview data). Our method also specifically applies to contexts in which an inductive thematic analysis [2–4] is used, where emergent themes are discovered in the data and then transformed into codes.
포화 및 질적 표본 크기 추정의 간략한 역사
A brief history of saturation and qualitative sample size estimation
질적 인터뷰는 몇 번이면 충분할까요? 지난 50여 년 동안 학계 전반에서 이 질문에 대한 답은 대개 포화 상태에 도달하는 것을 중심으로 이루어졌습니다[1, 5-9]. 포화라는 개념은 1967년 글레이저와 스트라우스가 저서 '근거 이론의 발견'에서 '이론적 포화'라는 이름으로 질적 연구 분야에 처음 도입했습니다[10]. 그들은 이 용어를 ["[연구자가] 범주의 속성을 개발할 수 있는 추가 데이터가 발견되지 않는 시점"]으로 정의했습니다(61페이지). 이 정의는 질적 데이터를 사용하여 이론적 모델을 구축하고 테스트하는 관행을 위해 특별히 고안되었으며, [개발 중인 이론적 모델이 안정화되는 시점]을 의미합니다. 그러나 많은 질적 데이터 분석은 특정 근거 이론 방법을 사용하지 않고 보다 [일반적인 귀납적 주제 분석]을 사용합니다. 시간이 지남에 따라 '데이터 포화'라는 용어와 개념의 광범위한 적용을 반영하기 위해 더 넓은 의미의 '데이터 포화'라는 용어가 점점 더 많이 채택되고 있습니다. 이러한 넓은 의미에서 포화 상태는 종종 [데이터 수집 및 분석]에서 [새로 들어오는 데이터가 연구 질문에 대한 새로운 정보를 거의 또는 전혀 생성하지 못하는 시점]으로 설명됩니다[4, 9, 11-13].
How many qualitative interviews are enough? Across academic disciplines, and for about the past five decades, the answer to this question has usually revolved around reaching saturation [1, 5–9]. The concept of saturation was first introduced into the field of qualitative research as “theoretical saturation” by Glaser and Strauss in their 1967 book The Discovery of Grounded Theory [10]. They defined the term as the point at which “no additional data are being found whereby the [researcher] can develop properties of the category” (pg. 61). Their definition was specifically intended for the practice of building and testing theoretical models using qualitative data and refers to the point at which the theoretical model being developed stabilizes. Many qualitative data analyses, however, do not use the specific grounded theory method, but rather a more general inductive thematic analysis. Over time, the broader term “data saturation” has become increasingly adopted, to reflect a wider application of the term and concept. In this broader sense, saturation is often described as the point in data collection and analysis when new incoming data produces little or no new information to address the research question [4, 9, 11–13].
흥미롭게도 포화 상태에 대한 경험적 연구는 포화 상태에 도달할 것으로 예상되는 시점을 결정하기 위한 노력에서 시작되었습니다. "포화 상태가 될 때까지 인터뷰"가 모범 사례로 인식되었지만, 표본 크기에 대한 충분한 설명은 아니었습니다. 대부분의 연구 맥락에서, 연구 수행 전에 자금 지원자, 윤리 위원회 및 기타 검토자가 표본 규모를 명시하고 정당성을 입증해야 합니다[14, 15]. 응용 질적 연구자들은 다음과 같은 질문에 직면했습니다: 현장에 들어가기 전에 얼마나 많은 인터뷰가 필요할지 어떻게 예측할 수 있을까요?
Interestingly, empirical research on saturation began with efforts to determine when one might expect it to be reached. Though “interviewing until saturation” was recognized as a best practice, it was not a sufficient description of sample size. In most research contexts, sample size specification and justification is required by funders, ethics committees, and other reviewers before a study is implemented [14, 15]. Applied qualitative researchers faced the question: How do I estimate how many interviews I’ll need before I head into the field?
이 문제를 해결하기 위한 경험적 연구는 2000년대 초부터 문헌에 등장하기 시작했습니다.
- Morgan 등[16]은 환경 위험에 대해 수집된 데이터를 사용하여 선구적인 방법론 연구를 수행했습니다. 그들은 처음 5~6개의 인터뷰가 데이터 세트에서 대부분의 새로운 정보를 생성했으며, 표본 크기가 20개에 가까워질수록 새로운 정보를 거의 얻지 못한다는 사실을 발견했습니다. 4개의 데이터 세트에서 데이터 세트 내에서 확인된 모든 개념의 약 80%~92%가 처음 10번의 인터뷰에서 발견되었습니다.
- 마찬가지로 Guest 등[9]은 서아프리카의 여성 성 노동자들을 대상으로 60건의 심층 인터뷰에 대한 단계적 귀납적 주제 분석을 수행한 결과, 114개의 식별된 주제 중 70%가 처음 6건의 인터뷰에서 나타났으며 92%가 처음 12건의 인터뷰에서 확인되었다는 사실을 발견했습니다.
- 프란시스(Francis) 연구팀과 네이미(Namey) 연구팀[17, 18]의 후속 연구에서도 비슷한 결과가 보고되었습니다.
- 이러한 초기 연구를 바탕으로 Hagaman과 Wutich[19]는 교차 문화 연구 내에서 포화를 계산한 결과, 4개 사이트 각각에서 데이터 포화에 도달하기 위해서는 16개 미만의 인터뷰만으로도 충분하지만, 사이트 간 교차 문화 메타 주제를 식별하려면 20~40개의 인터뷰가 필요하다는 사실을 발견했습니다.
Empirical research to address this issue began appearing in the literature in the early 2000s.
- Morgan et al. [16] conducted a pioneer methodological study using data collected on environmental risks. They found that the first five to six interviews produced the majority of new information in the dataset, and that little new information was gained as the sample size approached 20 interviews. Across four datasets, approximately 80% to 92% of all concepts identified within the dataset were noted within the first 10 interviews.
- Similarly, Guest et al. [9] conducted a stepwise inductive thematic analysis of 60 in-depth interviews among female sex workers in West Africa and discovered that 70% of all 114 identified themes turned up in the first six interviews, and 92% were identified within the first 12 interviews.
- Subsequent studies by Francis et al. and Namey et al. [17, 18] reported similar findings.
- Building on these earlier studies, Hagaman and Wutich [19] calculated saturation within a cross-cultural study and found that fewer than 16 interviews were enough to reach data saturation at each of the four sites but that 20–40 interviews were necessary to identify cross-cultural meta-themes across sites.
Galvin[20]은 메타 분석적 접근 방식을 사용하여 이항 논리를 사용하여 54개의 질적 연구를 검토하고 통계적으로 분석했습니다. 그는 6명의 개인 표본에서 특정 개념(주제)을 식별할 확률이 더 큰 연구 집단의 55%에서 해당 개념을 공유할 경우 99%보다 높다는 것을 발견했습니다.
- 이와 동일한 논리를 사용하여 Fugard와 Potts[21]는 정성적 데이터의 주제별 분석에 필요한 표본 크기를 추정하는 [정량적 도구]를 개발했습니다. 이 계산에는 (1) 모집단 내에서 주제의 예상 유병률, (2) 해당 주제의 원하는 인스턴스 수, (3) 연구에 필요한 검정력 등이 포함됩니다. 예를 들어, 이 도구는 모집단에서 유병률이 10%인 테마의 인스턴스 2개를 감지할 수 있는 80%의 힘을 가지려면 29명의 참가자가 필요하다고 추정합니다. 이 모델은 무작위 표본을 가정한다는 점에 유의하세요.
Using a meta-analytic approach, Galvin [20] reviewed and statistically analyzed—using binomial logic—54 qualitative studies. He found the probability of identifying a concept (theme) among a sample of six individuals is greater than 99% if that concept is shared among 55% of the larger study population.
- Employing this same logic, Fugard and Potts [21] developed a quantitative tool to estimate sample sizes needed for thematic analyses of qualitative data. Their calculation incorporates: (1) the estimated prevalence of a theme within the population, (2) the number of desired instances of that theme, and (3) the desired power for a study. Their tool estimates, for example, that to have 80% power to detect two instances of a theme with a 10% prevalence in a population, 29 participants would be required. Note that their model assumes a random sample.
위의 연구는 정성적 표본 크기 추정 분야의 기초가 되는 연구입니다. 이 연구들은 특정 연구에 필요한 정성적 인터뷰의 수를 추정하기 위한 경험적 기반 지침을 제공하며, 정량적 연구 설계의 검정력 계산과 유사한 역할을 합니다(물론 수학이나 정밀도가 떨어지는 경우도 있지만). 그리고 파워 계산과 마찬가지로, 데이터 수집이 시작되면 이 추정치도 논란의 여지가 있습니다. 추정치는 특정 연구의 다양한 요소에 관한 (지정된) 가정과 기대치를 기반으로 합니다. 모든 연구자가 알다시피, 현실은 종종 놀라움을 선사합니다. 연구에 특정 매개변수(정량적)가 적용되거나 경험적 지침에 따라 표본 크기가 정해져 있을 수 있지만(정성적), 데이터 수집이 완료된 후에는 결과 데이터가 어느 쪽에도 부합하지 않을 수 있습니다.
The above studies are foundational in the field of qualitative sample size estimation. They provide empirically-based guidance for approximating how many qualitative interviews might be needed for a given study and serve a role analogous to power calculations in quantitative research design (albeit in some case without the math and degree of precision). And, like power calculations, they are moot once data collection begins. Estimates are based on (specified) assumptions, and expectations regarding various elements in a particular study. As all researchers know, reality often presents surprises. Though a study may be powered to certain parameters (quantitative) or have a sample size based on empirical guidance (qualitative), after data collection is completed the resulting data may not conform to either.
당연히 연구자들은 최근 데이터 포화에 대해 추정을 넘어서는 두 가지 후속 질문을 하기 시작했습니다:
- 포화 개념을 더 잘 조작화하려면 어떻게 해야 할까요? 그리고
- 포화에 도달했는지 어떻게 알 수 있을까요?
Not surprisingly, researchers have recently begun asking two follow up questions about data saturation that go beyond estimation:
- How can we better operationalize the concept of saturation? and
- How do we know if we have reached saturation?
포화 조작화 및 평가
Operationalizing and assessing saturation
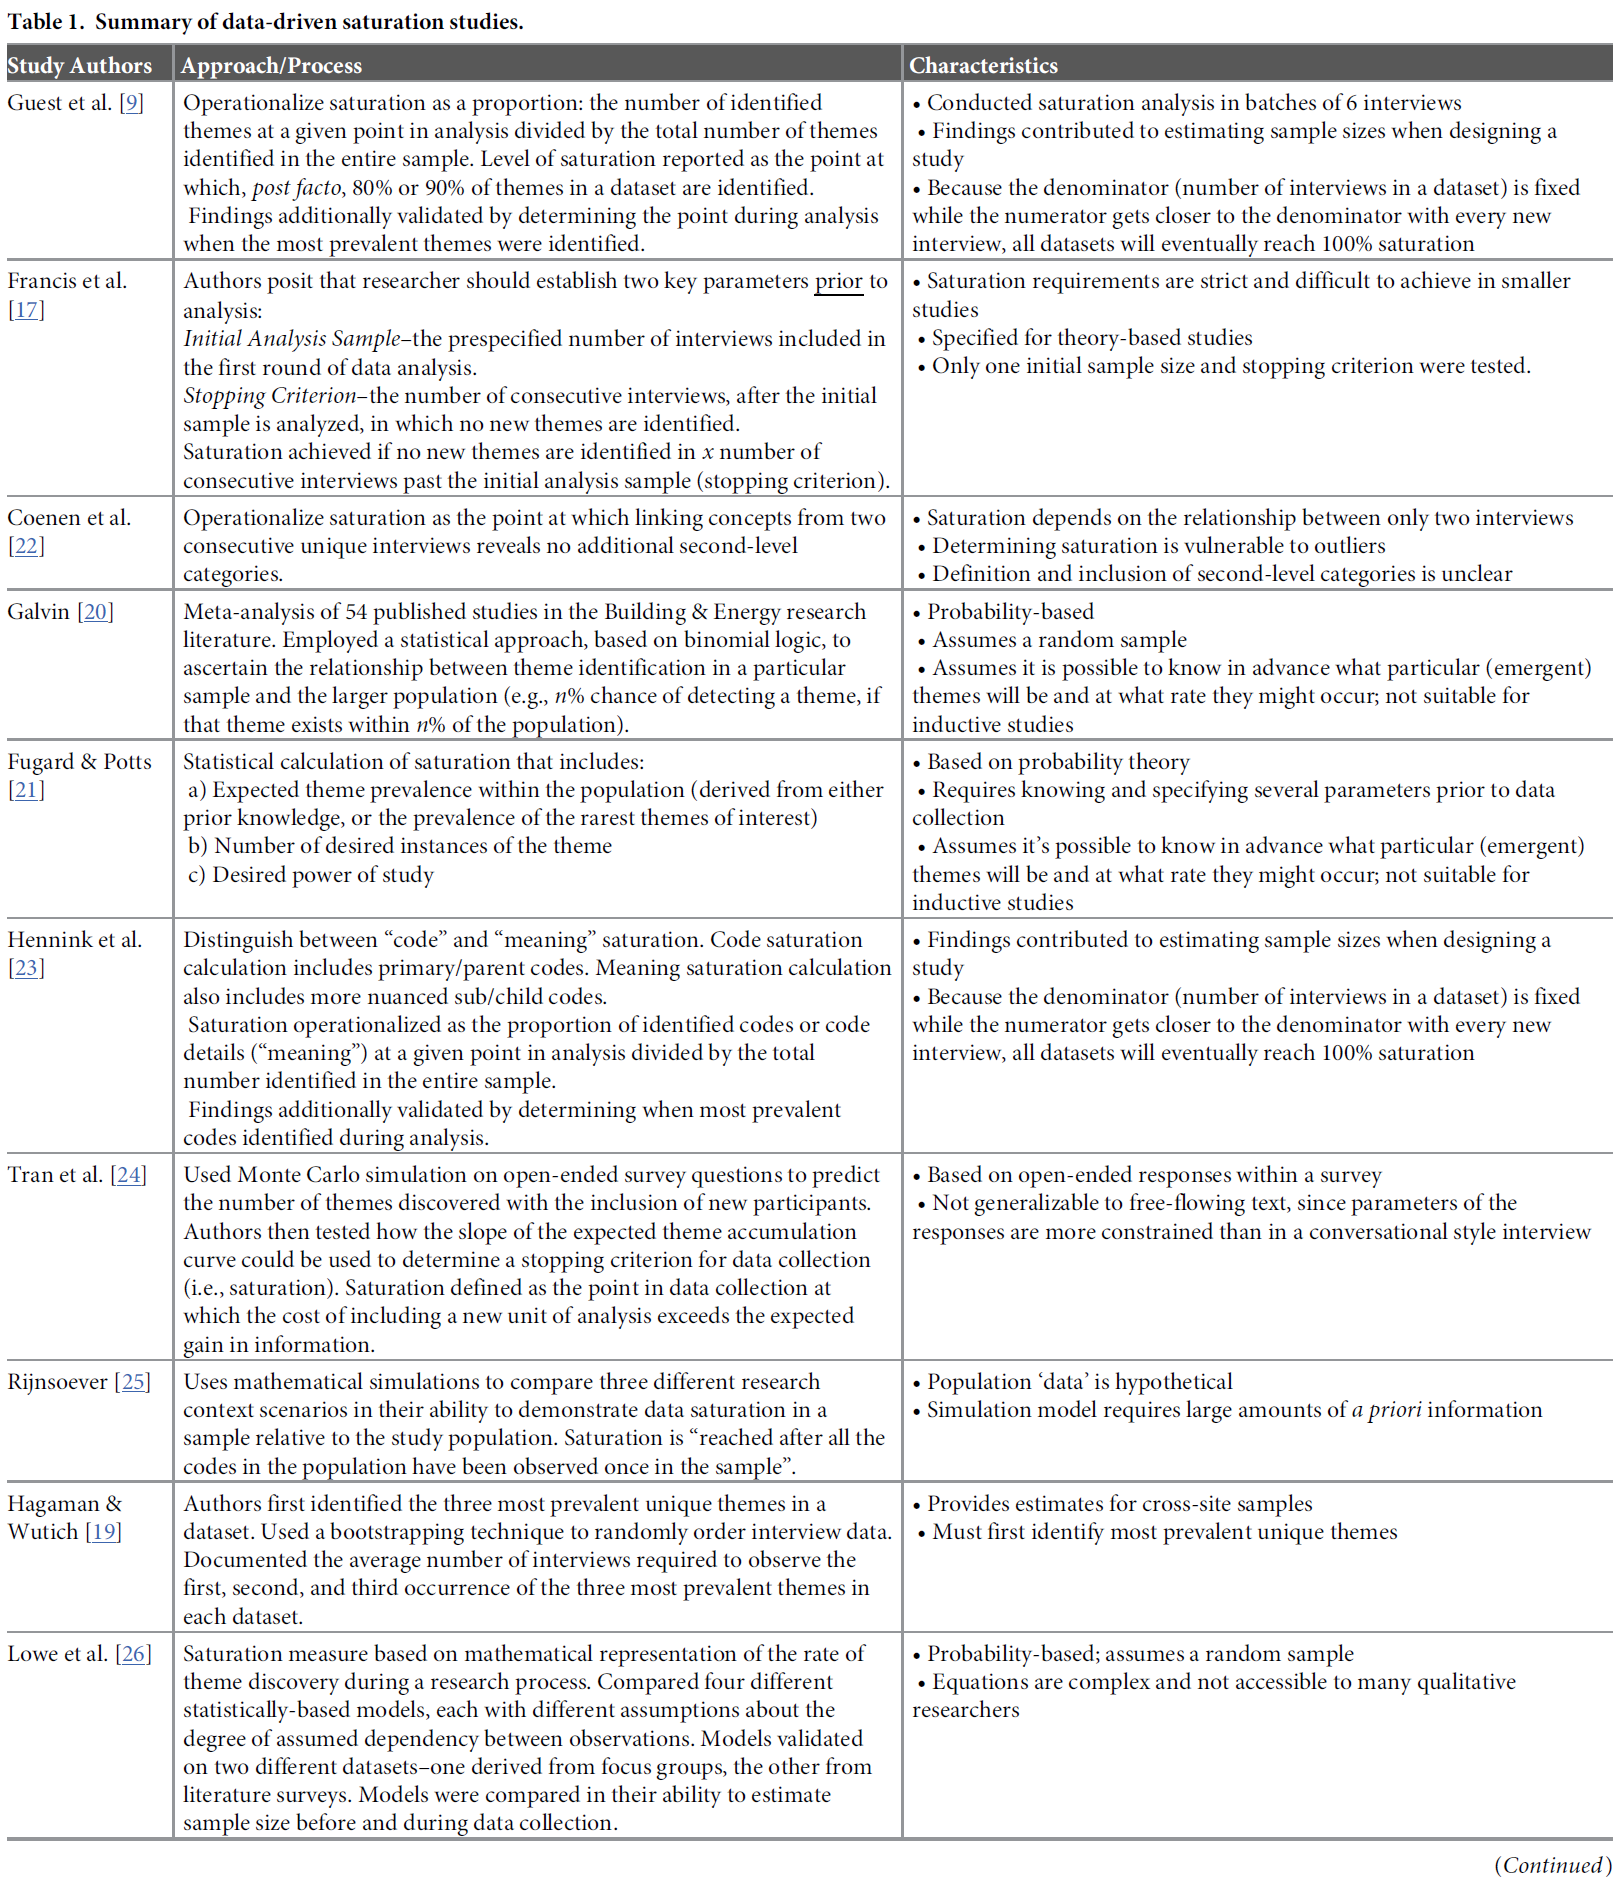
정성적 연구에서 포화에 대한 경험적 연구의 범위와 포화를 다루는 데이터 기반 연구에서 사용되는 운영 및 평가 메트릭에 대한 자세한 내용은 표 1에 요약되어 있습니다. 포화 평가에 대한 접근 방식의 개발을 위해 이러한 연구들을 검토하면서, 포화 평가 프로세스의 광범위한 적용에 대한 세 가지 한계를 확인했으며, 이를 극복하고자 했습니다.
- 메트릭의 비교 가능성 부족,
- 확률 이론 또는 무작위 샘플링에 대한 의존,
- 완전히 코딩/분석된 데이터 세트에 의존하는 후향적 평가의 한계
대안적인 접근 방식을 소개하기 전에 각 한계에 대해 간략히 설명합니다.
The range of empirical work on saturation in qualitative research and detail on the operationalization and assessment metrics used in data-driven studies that address saturation are summarized in Table 1. In reviewing these studies to inform the development of our approach to assessing saturation, we identified three limitations to the broad application of saturation assessment processes which we sought to overcome:
- lack of comparability of metrics,
- reliance on probability theory or random sampling, and
- retrospective assessment dependent on having a fully coded/analyzed dataset.
We discuss each limitation briefly before introducing our alternative approach.

메트릭의 비교 가능성 부족.
Lack of comparability in metrics.
현재 포화에 대한 조작화 방식은 [포화에 도달했는지 여부를 이분법적으로 판단]하는 데 사용되는 [기준이 매우 다양]합니다(예: Francis 외. [17] 및 Coenen 외. [22]). 분석 단위와 포화 임계값의 엄격성 측면에서 접근 방식이 얼마나 다른지 고려할 때, 포화 상태에 도달했는지 여부에 대한 결론에 대해 어느 정도의 확신을 가져야 하는지 이해하기는 어렵습니다. 통계적 분석 방법을 사용하는 정량적 연구자가 신뢰 구간 수준과 보고할 기타 지표에 대한 옵션을 설정한 것과 달리, [정성적 연구자]가 [포화 결과의 강도를 해석하는 데 도움이 되는 합의된 지표]가 없습니다. 우리가 제안하는 방법은 정성적 연구자가 다양한 수준의 평가 기준 중에서 선택할 수 있도록 하며, 이러한 기준에 대한 공통된 설명과 함께 사용된 기준의 엄격성에 따라 독자가 포화에 관한 결론을 어느 정도 자신 있게 해석할 수 있도록 합니다.
Current operationalizations of saturation vary widely in the criteria used to arrive at a binary determination of saturation having been reached or not reached (e.g., Francis et al. [17] and Coenen et al. [22]). Given how different approaches are–in terms of units of analysis and strictness of saturation thresholds–it is difficult to understand how much confidence to have in a conclusion about whether saturation was reached or not. Unlike quantitative researchers using statistical analysis methods who have established options for levels of confidence intervals and other metrics to report, there are no agreed-upon metrics to help qualitative researchers interpret the strength of their saturation findings. The method we propose facilitates qualitative researchers’ choice among levels of assessment criteria along with a common description of those criteria that will allow readers to interpret conclusions regarding saturation with more or less confidence, depending on the strictness of the criteria used.
확률 이론 및/또는 무작위 표본 가정에 의존합니다.
Reliance on probability theory, and/or the assumption of a random sample.
포화 평가를 [확률론적 가정](예: Lowe 등 [26], Fugard & Potts [21], Galvin [20])에 근거하는 것은 대부분의 질적 연구가 질적 조사의 성격과 목적에 적합한 [비확률적이고 의도적인 표본 추출을 사용한다는 사실]을 무시하는 것입니다[28]. 무작위 표본 추출을 사용하는 경우에도 질적 조사의 개방형 특성은 응답 범주가 구조화되어 있지 않고 상호 배타적이지 않기 때문에 대규모 모집단에 대한 확률 이론이나 통계적 추론에 적합하지 않습니다. 주제 A의 표현이 반드시 주제 B를 배제하는 것은 아니며, 주제 A의 표현이 없다고 해서 반드시 Not-A를 의미하는 것도 아닙니다. 또한, 로지스틱스 관점에서 볼 때, 많은 질적 연구자들은 데이터 세트에 대해 복잡한 통계적 테스트를 수행할 전문 지식이나 시간이 없습니다. 우리의 접근 방식은 단순한 산술과 백분율 계산만 포함합니다.
Basing assessments of saturation on probabilistic assumptions (e.g., Lowe et al. [26], Fugard & Potts [21], Galvin [20]) ignores the fact that most qualitative research employs non-probabilistic, purposive sampling suited to the nature and objectives of qualitative inquiry [28]. Even in cases where random sampling is employed, the open-ended nature of qualitative inquiry doesn’t lend itself well to probability theory or statistical inference to a larger population because response categories are not structured, so are not mutually exclusive. The expression of Theme A is not necessarily to the exclusion of Theme B, nor does the absence of the expression of Theme A necessarily indicate Not-A. Further, from a logistical standpoint, many qualitative researchers do not have the expertise, nor the time required, to perform complicated statistical tests on their datasets. Our approach involves only simple arithmetic and calculation of percentages.
후향적 평가는 완전히 코딩/분석된 데이터 세트가 있어야 합니다.
Retrospective assessment dependent on having a fully coded/analyzed dataset.
데이터 세트의 [전체 테마 수] 대비 [새로운 테마]의 비율을 기준으로 포화를 계산하는 방법(예: Guest 외. [9], Hennink 외. [23])은 수행된 총 인터뷰 수에 의해 제한됩니다. [분모]는 완전히 분석된 데이터 세트의 총 테마 수를 나타내며 고정되어 있는 반면 [분자의 테마 수]는 새로운 인터뷰를 고려할 때마다 분모에 가까워져 결국 100% 포화에 도달하게 됩니다. 후향적으로 평가되고 완전히 분석된 고정된 크기의 데이터 세트에서는 [필연적으로 포화 상태가 발생]합니다. 우리가 설명하는 방법은 전체 데이터 세트 대신 분모에 데이터 항목의 하위 집합을 사용함으로써 이 문제를 해결하여 포화를 보다 전향적으로 평가하고 연구자가 미리 지정한 인터뷰 횟수에 도달하기 전에 중단할 수 있는 이점을 제공합니다. (그러나 이 접근 방식에서는 저자들이 정의한 포화 비율을 측정할 수 없습니다.)
Methods that calculate saturation based on the proportion of new themes relative to the overall number of themes in a dataset (e.g., Guest et al. [9], Hennink et al. [23]) are limited by the total number of interviews conducted: the denominator represents the total number of themes in the fully-analyzed dataset and is fixed, while the number of themes in the numerator gets closer to the denominator with every new interview considered, thus eventually reaching 100% saturation. Saturation will inevitably occur in a retrospectively-assessed, fully-analyzed, fixed-size dataset. The method we outline eliminates this problem by using a subset of data items in the denominator instead of the entire dataset, facilitating better prospective assessment of saturation and offering the advantage of allowing researchers to stop before reaching a pre-specified number of interviews. (Under our approach, however, a measure of percent saturation as defined by these authors will not be available.)
방법
Methods
포화 계산 및 보고에 대한 대안적 접근 방식 및 방법
An alternative approach and method to calculating and reporting saturation
평가의 목적상, [포화]는 데이터 분석 중 들어오는 데이터 포인트(인터뷰)가 연구 목표와 관련하여 새롭고 유용한 정보를 거의 또는 전혀 생성하지 않는 시점을 의미합니다. 이러한 포화의 정의를 운영하기 위한 우리의 접근 방식은 [기본 크기, 실행 길이, 들어오는 새로운 정보의 상대적 양 또는 새로운 정보 임계값]이라는 [세 가지 요소]로 구성됩니다.
For the purposes of our assessment, saturation refers to the point during data analysis at which incoming data points (interviews) produce little or no new useful information relative to the study objectives. Our approach to operationalizing this definition of saturation consists of three distinct elements–
- the base size,
- the run length, and
- the relative amount of incoming new information, or the new information threshold.
기본 크기.
Base size.
포화를 평가할 때 [들어오는 정보]는 [이미 획득한 정보]와 비교하여 가중치를 부여합니다. [기본 크기]는 나중에 [분모]로 사용할 데이터 집합에서 이미 식별된 정보 본문을 어떻게 둘러싸는지를 나타냅니다(Francis 등의 초기 분석 샘플과 유사). 다시 말해, 이미 확보한 정보의 양을 계산하기 위해 검토/분석해야 하는 최소 데이터 수집 이벤트(예: 인터뷰)의 수는 얼마인가? 모든 데이터 수집 이벤트를 기본 크기로 사용하면 더 이상 고려할 데이터가 없기 때문에 기본적으로 포화 상태에 도달할 수 있다는 것을 알고 있습니다. 또한 이전 연구[9, 16, 29]에 따르면 정성적 데이터 세트에서 대부분의 새로운 정보는 프로세스 초기에 생성되며, 일반적으로 점근 곡선을 따르고, 소수의 데이터 수집/분석 이벤트 이후에는 새로운 정보가 상대적으로 급격히 감소한다는 사실도 알고 있습니다. 이러한 이유로 [포화 비율의 분모에 사용할 총 고유 테마 수]를 계산하기 위한 기본 크기로 4, 5, 6개의 인터뷰를 테스트하기로 선택했습니다. 기준 크기의 분석 단위는 데이터 수집 이벤트이며, 분석 항목은 테마를 나타내는 고유 코드입니다.
When assessing saturation, incoming information is weighed against the information already obtained. Base size refers to how we circumscribe the body of information already identified in a dataset to subsequently use as a denominator (similar to Francis et al.’s initial analysis sample). In other words, what is the minimum number of data collection events (i.e., interviews) we should review/analyze to calculate the amount of information already gained? We know that if we use all of the data collection events as our base size, we can reach saturation by default as there are no more data to consider. We also know from previous studies [9, 16, 29] that most novel information in a qualitative dataset is generated early in the process, and generally follows an asymptotic curve, with a relatively sharp decline in new information occurring after just a small number of data collection/analysis events. For this reason, we have chosen to test 4, 5, and 6 interviews as base sizes from which to calculate the total number of unique themes to be used in the denominator of the saturation ratio. The unit of analysis for base size is the data collection event; the items of analysis are unique codes representing themes.
실행 길이.
Run length.
[실행run]은 [연속적인 이벤트 또는 관찰(이 경우 인터뷰)의 집합]으로 정의할 수 있습니다. [실행 길이]는 [새로운 정보를 찾고 계산하는 인터뷰 횟수]입니다. 실행에서 발견된 [새로운 테마의 수]는 [포화 비율]의 [분자]를 정의합니다. 예를 들어, Hagaman과 Wutich(2017)와 Francis 등(2010)은 분자에 대한 새로운 테마의 수를 (재)평가할 때마다 3개의 데이터 수집 이벤트의 실행을 고려하는 반면, Coenen 등(2012)은 데이터 실행에 2개의 이벤트만 포함시킵니다. 저희 분석에서는 연구자에게 더 많은 유연성을 제공하기 위해 두 개의 이벤트와 세 개의 이벤트 등 두 가지 실행 길이 옵션을 계산에 제공합니다. 분석에서 연속적인 실행은 겹치는데, 각 인터뷰 세트는 하나의 이벤트에 의해 시간이 오른쪽으로 또는 "앞으로" 이동합니다. 그림 1은 이 프로세스와 기본 크기 및 실행 길이가 서로 어떻게 연관되는지 보여줍니다. 여기서도 분석 단위는 데이터 수집 이벤트이며, 분석 항목은 고유 코드입니다.
A run can be defined as a set of consecutive events or observations, in this case interviews. The run length is the number of interviews within which we look for, and calculate, new information. The number of new themes found in the run defines the numerator in the saturation ratio. Hagaman and Wutich (2017) and Francis et al. (2010), for example, consider runs of three data collection events each time they (re)assess the number of new themes for the numerator, whereas Coenen et al. (2012) include only two events in their data runs. For our analyses we provide both options for run lengths in our calculations–two events and three events–to afford researchers more flexibility. Note that in our analyses, successive runs overlap: each set of interviews shifts to the right or “forward” in time by one event. Fig 1 shows the process, and how base size and run length relate to one another. Here again the unit of analysis is the data collection event; the items of analysis are unique codes.

새로운 정보 임계값.
New information threshold.
[분자]와 [분모]에 대한 분석 단위가 결정되면 [비례 계산]은 간단합니다. 하지만 다음 질문은 순전히 주관적인 질문입니다: 어느 정도의 새로운 정보 부족을 포화 상태의 지표로 받아들여야 할까요? 규범적인 기준이 아니라 연구자에게 선택권을 제공하는 것이 더 현실적이고 투명하며 정확한 방법이라고 생각합니다. 따라서 데이터 수집의 특정 시점에 포화 상태에 도달했다는 증거로 받아들일 수 있는 새로운 정보의 비율을 나타내는 두 가지 수준의 새로운 정보, 즉 ≤5% 새로운 정보 및 새로운 정보 없음(0%)을 우선 제안합니다.
Once units of analysis for the numerator and denominator are determined the proportional calculation is simple. But the next question is a purely subjective one: What level of paucity of new information should we accept as indicative of saturation? We propose that furnishing researchers with options—rather than a prescriptive threshold—is a more realistic, transparent and accurate practice. We therefore propose initially two levels of new information that represent the proportion of new information we would accept as evidence that saturation has been reached at a given point in data collection:
- ≤5% new information and
- no (0%) new information.
이러한 새로운 정보 임계값은 통계 분석에서 귀무가설을 거부하기에 충분한 증거가 존재하는지 여부를 판단하기 위해 0.05 또는 0.01 미만의 p값을 사용하는 것과 유사한 벤치마크로 사용할 수 있습니다. 통계 분석에서와 마찬가지로, 확률 이론이 없으므로 이러한 임계값을 충족할 때 실제로 포화 상태에 도달한다는 보장은 없습니다. 그러나 이 임계값은 다른 연구자들이 나중에 해석할 수 있는 [데이터 포화 평가를 투명하게 제시하는 방법]을 제공합니다. 새로운 정보 임계값이 낮을수록 임계값에 도달했을 때 데이터 수집이 중단될 경우 이후 인터뷰에서 중요한 주제가 발견되지 않을 가능성이 줄어듭니다. 기본 크기, 실행 길이, 새로운 정보 임계값의 개념을 종합하면 연구자는 포화 개념을 [얼마나 엄격하게 적용할지], 그리고 주어진 샘플에 대해 [데이터 포화에 도달했다고 확신할 수 있는 수준]을 선택할 수 있습니다(그림 2).
These new information thresholds can be used as benchmarks similar to how a p-value of <0.05 or <0.01 is used to determine whether enough evidence exists to reject a null hypothesis in statistical analysis. As in statistical analysis—but absent the probability theory—there is no guarantee that saturation is in fact reached when meeting these thresholds. But they do provide a transparent way of presenting data saturation assessments that can be subsequently interpreted by other researchers. The lower the new information threshold, the less likely an important number of themes may remain undiscovered in later interviews if data collection stops when the threshold is reached. Taken together, the concepts of base size, run length, and new information threshold allow researchers to choose how stringently they wish to apply the saturation concept–and the level of confidence they might have that data saturation was attained for a given sample (Fig 2).

우리가 제안하는 방법의 장점은 여러 가지가 있습니다:
The advantages of the method we propose are several:
- 무작위 샘플을 가정하거나 필요하지 않으며, 주제의 빈도에 대한 사전 지식이 필요하지 않습니다.
- 계산이 간단합니다. 통계적 전문 지식이 없어도 빠르게 계산할 수 있습니다.
- 메트릭은 데이터 수집 및 분석 프로세스 중에 전향적으로 사용하여 포화 상태에 도달하는 시점을 확인할 수 있습니다(계획보다 적은 수의 데이터 수집 이벤트를 수행할 가능성도 제공).
- 메트릭은 데이터 수집 및 분석이 완료된 후 소급하여 주제별 포화에 도달하기 위한 샘플의 적절성에 대해 보고하는 데 사용할 수 있습니다.
- 각 메트릭에 대한 옵션은 분석 전에 지정하거나 데이터 분석 후에 보고할 수 있습니다.
- 메트릭은 유연합니다. 연구자는 채도를 설명하는 방법에 대한 옵션을 선택할 수 있으며, 보다 투명하고 정확하게 용어를 사용할 수도 있습니다.
- 포화는 상대적인 측정값으로 개념화됩니다. 이 방법은 분자와 분모 모두에 영향을 미치기 때문에 연구자 간의 코딩 세부 수준 차이를 중화합니다.
- It does not assume or require a random sample, nor prior knowledge of theme prevalence.
- Calculation is simple. It can be done quickly and with no statistical expertise.
- Metrics can be used prospectively during the data collection and analysis process to ascertain when saturation is reached (and providing the possibility of conducting fewer data collection events than planned).
- Metrics can be used retrospectively, after data collection and analysis are complete, to report on the adequacy of the sample to reach thematic saturation.
- Options for each metric can be specified prior to analysis or reported after data analysis.
- The metrics are flexible. Researchers have options for how they describe saturation and can also use the term with more transparency and precision.
- Saturation is conceptualized as a relative measure. This neutralizes differences in the level of coding granularity among researchers, as the method affects both numerator and denominator.
접근 방식의 적용
Application of the approach
예상 데이터 포화 계산의 예입니다.
An example of prospective data saturation calculation.
접근 방식을 설명하기 위해 가상의 데이터 세트를 사용하여 이 프로세스가 어떻게 작동하는지에 대한 단계별 예를 살펴봅시다. 기본 인터뷰 크기 4개, 실행 길이 2개를 사용하여 포화를 전향적으로 계산해 보겠습니다. 이 예에서는 적절한 포화에 도달했음을 나타내기 위해 ≤5%의 새로운 정보 임계값을 선택했습니다. 각 단계에 사용된 데이터는 [그림 3]에 기본, 실행 및 포화 지점 표시와 함께 포함되어 있습니다.
Let’s consider a step-by-step example of how this process works, using a hypothetical dataset to illustrate the approach. We will prospectively calculate saturation using a base size of 4 interviews and run length of 2 interviews. For this example, we have selected a new information threshold of ≤5% to indicate that we have reached adequate saturation. [The data used for each step are included in Fig 3, along with indication of the base, runs, and saturation points.]

1단계 - 베이스가 될 고유 테마의 수를 찾습니다.
STEP 1 –Find the number of unique themes for base.
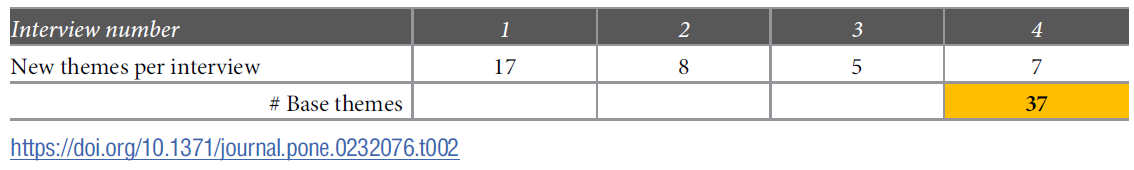
먼저 처음 4개의 인터뷰를 살펴보고 [이 그룹 내에서 식별된 고유 테마의 수]를 합산합니다. 결과 합계인 37이 방정식의 분모가 됩니다.
We start by looking at the first four interviews conducted and summing the number of unique themes identified within this group. The resulting sum, 37, is the denominator in our equation.
2단계-첫 번째 실행에 대한 고유 테마의 수를 찾습니다.
STEP 2—Find the number of unique themes for the first run.
이 예에서는 [실행 길이]를 2로 사용하므로 기본 세트 이후의 [다음 두 인터뷰(즉, 인터뷰 5와 6)에 대한 데이터]를 포함합니다. 이러한 인터뷰를 검토한 후 인터뷰 5에서 4개의 새로운 테마를, 인터뷰 6에서 3개의 새로운 테마를 확인했다고 가정합니다. 이 첫 번째 실행에서 새로운 테마의 수는 7개입니다.
In this example, we’re using a run length of two, so include data for the next two interviews after the base set–i.e., interviews 5 and 6. After reviewing those interviews, let’s say we identified four new themes in interview 5 and three new themes in interview 6. The number of new themes in this first run is seven.

3단계 - 포화 비율을 계산합니다.
STEP 3 –Calculate the saturation ratio.
이 실행의 새 테마 수(7개)를 기본 세트의 고유 테마 수(37개)로 나눕니다. 이 비율은 19%의 새로운 정보를 나타냅니다. 이는 ≤5% 임계값에 미치지 않으므로 계속 진행합니다.
Divide the number of new themes in this run (seven) by the number of unique themes in the base set (37). The quotient reveals 19% new information. This is not below our ≤5% threshold, so we continue.

4단계 - 시리즈의 다음 실행을 위한 새로운 고유 테마의 수를 찾습니다.
STEP 4 –Find the number of new unique themes for the next run in the series.
다음 실행에서는 다음 두 인터뷰인 6번과 7번의 새 테마를 추가하여(인터뷰 6번과 겹침에 유의) 총 4개의 테마를 만듭니다.
For the next run we add the new themes for the next two interviews, 6 and 7 (note the overlap of interview 6), resulting in a sum of four.
5단계-채도 비율 업데이트.
STEP 5—Update saturation ratio.
최신 실행의 새 테마 수(4개)를 기본 세트의 테마 수(37개)로 나눕니다. 이렇게 하면 11%의 지수가 렌더링되지만 여전히 ≤5% 임계값에 미치지 못합니다. 다음 실행을 계속합니다.
Take the number of new themes in the latest run (four) and divide by the number of themes in the base set (37). This renders a quotient of 11%, still not below our ≤5% threshold. We continue to the next run.

6단계 - 시리즈의 다음 실행을 위한 새로운 고유 테마의 수를 찾습니다.
STEP 6 –Find the number of new unique themes for the next run in the series.
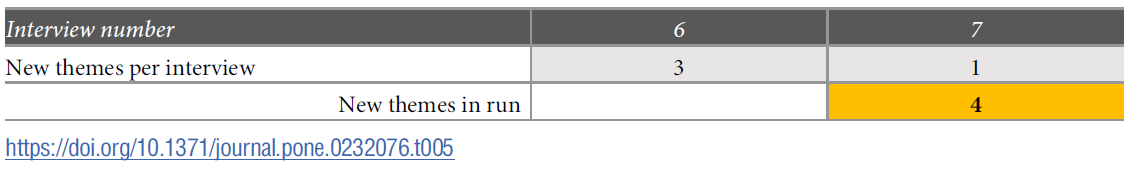
이번 세 번째 실행에서는 인터뷰 7과 8에서 확인된 새로운 테마의 수를 추가합니다.
For this third run we add the number of new themes identified within interviews 7 and 8.

7단계 - 채도 비율을 업데이트합니다.
STEP 7—Update saturation ratio.
최신 실행의 새 테마 수(1개)를 기본 세트의 테마 수(37개)로 나눕니다.
Take the number of new themes in the latest run (one) divided by the number of themes in the base set (37).
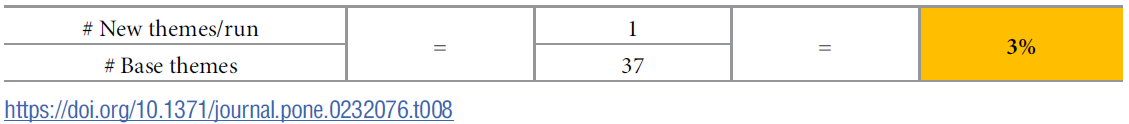
이 시점에서 마지막 실행으로 [추가된 새로운 정보의 비율]이 우리가 설정한 [≤5% 임계값]보다 낮으므로 8번째 인터뷰 후 여기서 멈추고 주관적인 지표인 ≤5%에 따라 포화 상태에 도달했다고 말할 수 있는 수준으로 새로운 정보의 양이 감소하고 있다는 것을 알 수 있습니다. 마지막 두 번의 인터뷰는 수집된 정보에 크게 추가되지 않았으므로 [6번째 인터뷰]에 포화 상태에 도달했다고 말할 수 있습니다(다음 두 번의 인터뷰는 각각 얼마나 많은 새로운 정보가 생성되는지, 그리고 이것이 설정된 임계값 아래로 떨어질지 확인하기 위해 완료되었습니다). 인터뷰 번호에 위첨자 "+2"를 추가하여 총 8개의 인터뷰가 완료되었음을 표시함으로써 이 두 개의 추가 인터뷰(실행 길이를 나타냄)에 주석을 달 것입니다. 포화 평가를 작성할 때 기본 크기 4를 사용하면 6+2번의 인터뷰를 통해 ≤5%의 새로운 정보 임계값에 도달했다고 말할 수 있습니다.
At this point the proportion of new information added by the last run is below the ≤5% threshold we established, so we stop here after the 8th interview and have a good sense that the amount of new information is diminishing to a level where we could say saturation has been reached based on our subjective metric of ≤5%. Since the last two interviews did not add substantially to the body of information collected, we would say that saturation was reached at interview 6 (each of the next two interviews were completed to see how much new information would be generated and whether this would fall below the set threshold). We would annotate these two extra interviews (indicative of run length) by appending a superscript “+2” to the interview number, to indicate a total of eight interviews were completed. In writing up our saturation assessment then, we would say that using a base size 4 we reached the ≤5% new information threshold at 6+2 interviews.
이 예에서 포화 상태에 도달했다는 결론에 좀 더 보수적이고 확신을 갖고 싶다면 평가의 두 가지 매개 변수를 조정할 수 있습니다. 실행 기간을 3회(또는 그보다 더 많은 횟수)로 늘리거나, 새로운 정보 임계값을 '새로운 정보 없음'으로 더 엄격하게 설정할 수 있습니다. 여기서 사용된 가상의 데이터 세트(그림 3 참조)를 고려하고 실행 길이를 2로 유지했다면 인터뷰 10+2에서 0%의 새로운 정보 임계값에 도달했을 것입니다.
If we wanted to be more conservative, and confident in our conclusion of reaching saturation in this example, we could adjust two parameters of our assessment. We could increase the run length to 3 (or an even larger number), and/or we could set a more stringent new information threshold of no new information. If we consider the hypothetical data set used here (see Fig 3) and kept the run length of 2, the 0% new information threshold would have been reached at interview 10+2.
위의 예제 프로세스를 검토한 후에도 여전히 두 가지 논리적 질문을 제기할 수 있습니다. 첫 번째는 "포화 상태가 표시될 때 샘플을 n으로 제한함으로써 중요한 정보를 놓치고 있지 않다는 것을 어떻게 알 수 있는가?"입니다. 다시 말해, 예를 들어 인터뷰를 5번 더 진행했다면 더 중요한 데이터를 추가로 얻을 수 있었을까요? 이에 대한 정직한 대답은 5번의 추가 인터뷰와 그 이후에도 5번의 추가 인터뷰를 실시하지 않는 한 알 수 없다는 것입니다. 그렇기 때문에 인터뷰 질문, 표본 특성 및 기타 연구 매개변수를 비교적 일관되게 유지한다고 가정할 때 시간이 지남에 따라 새로운 정보가 등장하는 속도가 감소하고 가장 일반적이고 두드러진 주제가 조기에 생성된다는 경험적 연구에 의존하고 있습니다. 추가 인터뷰 실시가 포화에 어떤 영향을 미쳤는지 더 자세히 설명하기 위해 그림 3에 20개의 인터뷰를 포함시켰습니다. 인터뷰 12에 이어 진행된 인터뷰에서는 4개의 주제가 추가되었지만 새로운 정보 임계치 ≤5% 이하에 머물렀습니다.
One may still raise two logical questions after reviewing the example process above. The first is “How do we know that we’re not missing important information by capping our sample at n when saturation is indicated?” Put another way, if we had conducted, say, five more interviews would we have gotten additional and important data? The honest answer to this is that we don’t know, and we can never know unless we conduct those five extra interviews, and then five more after that and so on. That is where we rely on the empirical research that shows the rate at which new information emerges decreases over time and that the most common and salient themes are generated early, assuming that we keep the interview questions, sample characteristics, and other study parameters relatively consistent. To further illustrate how saturation may have been affected by doing additional interviews, we include 20 interviews in Fig 3. The interviews following Interview 12, though yielding four additional themes, remained at or below the ≤5% new information threshold.
두 번째 질문은 첫 번째 질문과 어느 정도 관련이 있으며 가능한 [순서 효과]와 관련이 있습니다. 20개의 인터뷰로 구성된 데이터 집합에서 10번부터 20번까지의 인터뷰가 먼저 수행된 경우 테마 식별 패턴이 동일하게 보일까요? 데이터 수집 과정의 후반부에 새로운 주제가 나타날 수 있을까요? 프로세스/데이터셋의 후반부에 중요한 테마가 나타날 수도 있지만, 위에서 언급한 경험적 연구에 따르면 가장 널리 퍼진 상위 테마는 데이터 수집 초기에 약 6번의 인터뷰 내에서 식별되는 것으로 나타났습니다. 하지만 이를 더욱 확인하기 위해 세 가지 실제 데이터 세트에 [부트스트랩 기법]을 사용하여 이러한 초기 연구의 결과를 확증하고 제안된 메트릭의 분포 특성을 평가했습니다. 이러한 부트스트랩 결과는 새로운 인터뷰에서 새로운 주제가 발견될 때, 그리고 인터뷰 샘플의 다른 복제본에서 무작위로 인터뷰 순서를 정할 때 다양한 중단 지점에서 어떻게 포화에 도달할 수 있는지에 대한 정보를 제공합니다.
The second question is to a degree related to the first question and pertains to possible order effects. Would the theme identification pattern in a dataset of 20 interviews look the same if interviews #10 through #20 were conducted first? Could new themes start emerging later in the data collection process? Though it is possible an important theme will emerge later in the process/dataset, the empirical studies referenced above demonstrate that the most prevalent, high-level, themes are identified very early on in data collection, within about six interviews. But, to further check this, we use a bootstrapping technique on three actual datasets to corroborate findings from these earlier studies and to assess the distributional properties of our proposed metrics. These bootstrap findings give us information on how saturation may be reached at different stopping points as new themes are discovered in new interviews and when the interviews are ordered randomly in different replications of the sample of interviews.
샘플 데이터 세트.
Sample datasets.
부트스트래핑 방법을 적용한 기존의 정성적 데이터 세트 세 개를 선택했습니다. 이 데이터셋은 모두 귀납적 주제 분석 접근법을 사용하여 분석한 개별 인터뷰로부터 생성되었지만, 아래에 설명된 바와 같이 연구 모집단, 질문 주제, 표본 이질성, 인터뷰어, 데이터 수집 도구의 구조가 서로 달랐습니다.
We selected three existing qualitative datasets to which we applied the bootstrapping method. Although the datasets were all generated from individual interviews analyzed using an inductive thematic analysis approach, the studies from which they were drawn differed with respect to study population, topics of inquiry, sample heterogeneity, interviewer, and structure of data collection instrument, as described below.
데이터 세트 1. 이 연구에서는 미국 남동부 지역의 아프리카계 미국인 남성을 대상으로 건강 추구 행동에 대해 40건의 개별 인터뷰를 실시했습니다[29]. 인터뷰 가이드에는 13개의 주요 질문과 각 질문마다 스크립트로 작성된 하위 질문이 포함되어 있었습니다. 모든 인터뷰에는 귀납적 프로빙이 사용되었습니다. 귀납적 주제 분석에는 13개 질문 중 11개가 포함되었으며 93개의 고유 코드가 생성되었습니다. 연구 샘플은 매우 동질적이었습니다.
Dataset 1. This study included 40 individual interviews with African American men in the Southeast US about their health seeking behaviors [29]. The interview guide contained 13 main questions, each with scripted sub-questions. Inductive probing was employed throughout all interviews. The inductive thematic analysis included 11 of the 13 questions and generated 93 unique codes. The study sample was highly homogenous.
데이터 세트 2. 두 번째 데이터 세트는 임신 중 의학적 위험과 연구에 대해 미국 남동부의 (대부분 백인) 산모와 실시한 48건의 개별 인터뷰로 구성됩니다[30]. 인터뷰 가이드에는 13개의 주요 질문과 각 질문마다 스크립트로 작성된 하위 질문이 포함되어 있습니다. 모든 인터뷰에는 귀납적 프로빙이 사용되었습니다. 48건의 인터뷰는 대면, 화상(Skype와 유사한 플랫폼), 이메일(비동기), 문자 채팅(동기) 등 다양한 데이터 수집 모드를 사용하여 각각 12건씩 진행되었습니다. 정성적 주제 분석에는 이 중 10개의 질문이 포함되었으며 85개의 고유 코드가 생성되었습니다.
Dataset 2. The second dataset consists of 48 individual interviews conducted with (mostly white) mothers in the Southeast US about medical risk and research during pregnancy [30]. The interview guide contained 13 main questions, each with scripted sub-questions. Inductive probing was employed throughout all interviews. Of note, the 48 interviews were conducted, 12 each, using different modes of data collection: in-person, by video (Skype-like platform), email (asynchronous), or text chat (synchronous). The qualitative thematic analysis included 10 of these questions and generated 85 unique codes.
데이터 세트 3. 이 연구에는 HIV 감염 고위험군 여성 60명(케냐 30명, 남아공 30명)과의 인터뷰가 포함되었습니다[31]. 인터뷰는 정량적 설문조사에 대한 여성들의 응답에 대한 후속 정성적 조사였습니다. 가이드에는 14개의 질문이 있었지만, 여기서는 세 가지 질문의 데이터만 주제별 분석에 포함했습니다. 이 세 가지 질문에서 55개의 코드가 생성되었습니다. 두 사이트의 참가자는 학력과 결혼 여부를 제외하고는 인구통계학적으로 비슷했습니다. 케냐 표본에서는 기혼 여성과 배우자와 함께 사는 여성이 훨씬 더 많았으며(63% 대 3%), 중등 교육 이상을 이수한 비율은 더 낮았습니다. 모든 인터뷰는 현지 언어로 진행되었습니다.
Dataset 3. This study included 60 interviews with women at higher risk of HIV acquisition—30 participants in Kenya and 30 in South Africa [31]. The interview was a follow-up qualitative inquiry into women’s responses on a quantitative survey. Though there were 14 questions on the guide, only data from three questions were included in the thematic analysis referenced here. Those three questions generated 55 codes. Participants from the two sites were similar demographically with the exceptions of education and marital status. Substantially more women from the Kenya sample were married and living with their partners (63% versus 3%) and were less likely to have completed at least some secondary education. All interviews were conducted in a local language.
세 연구의 데이터는 모두 전사 프로토콜[32]을 사용하여 디지털로 기록 및 전사되었으며, 데이터세트 3의 경우 전사본이 영어로 번역되었습니다. 코딩 및 분석을 용이하게 하기 위해 트랜스크립트를 NVivo[33]로 가져왔습니다. 세 데이터세트 모두 체계적인 귀납적 주제 접근법[2]을 사용하여 분석했으며, 모든 코드는 표준 템플릿[34]에 따라 코드북에 명시적으로 정의되었습니다. 데이터세트 1과 2의 경우, 두 명의 분석가가 각 트랜스크립트를 독립적으로 코딩하고 각 트랜스크립트마다 코드 적용을 비교했습니다. 코드 적용의 불일치는 토론을 통해 해결되어 합의에 따라 코딩된 문서가 만들어졌습니다. 데이터세트 3의 경우, 두 명의 코더가 인터뷰의 20%에 대해 이러한 유형의 코더 간 신뢰도 평가를 실시했습니다(모든 인터뷰를 이중 코딩하는 것보다 표준적이고 효율적인 접근 방식입니다[2]). 데이터셋 3을 생성한 연구는 케냐와 남아프리카의 현지 IRB에서도 검토 및 승인을 받았으며, 세 연구 모두 FHI 360 인간 대상자 보호 위원회의 검토 및 승인을 받았습니다.
Data from all three studies were digitally recorded and transcribed using a transcription protocol [32]; transcripts were translated to English for Dataset 3. Transcripts were imported into NVivo [33] to facilitate coding and analysis. All three datasets were analyzed using a systematic inductive thematic approach [2], and all codes were explicitly defined in a codebook following a standard template [34]. For Datasets 1 & 2, two analysts coded each transcript independently and compared code application after each transcript. Discrepancies in code application were resolved through discussion, resulting in consensus-coded documents. For Dataset 3, two coders conducted this type of inter-coder reliability assessment on 20% of the interviews (a standard, more efficient approach than double-coding all interviews [2]). All three studies were reviewed and approved by the FHI 360 Protection of Human Subjects Committee; the study which produced Dataset 3 was also reviewed and approved by local IRBs in Kenya and South Africa.
부트스트래핑 방법.
Bootstrapping method.
이 세 가지 연구는 다양하고 분석적으로 엄격한 사례 연구를 제공하지만, 일반화 가능성은 제한적입니다. 모집단 수준의 통계에 근사치를 구하고 검증 범위를 넓히기 위해 위에서 설명한 각 데이터 세트에서 경험적 부트스트랩 샘플을 추출했습니다. 부트스트랩 방법은 표본 내의 변동성을 사용하여 지표(이 경우 포화 지표)의 샘플링 분포를 경험적으로 추정하는 리샘플링 기법입니다[35]. 이는 원래의 샘플링 체계를 모방하는 방식으로 표본에서 무작위로 교체(즉, 한 항목이 리샘플링에서 두 번 이상 선택될 수 있음)를 통해 여러 번 리샘플링하는 방식으로 수행됩니다. 각 정성적 데이터 세트에 대해 원본 샘플에서 10,000개의 [리샘플을 생성]했습니다. 또한 각 리샘플에서 선택한 [녹취록의 순서를 무작위로 지정]하여 새로운 코드가 발견되는 방법과 시기에 대한 순서 효과를 상쇄했습니다. 각 리샘플에 대해 4, 5 또는 6개의 인터뷰로 구성된 기본 크기 대비 2 또는 3개의 새로운 이벤트 실행 길이에서 발견된 새로운 테마의 비율을 계산했습니다. 그런 다음 ≤5% 또는 0%의 새로운 정보 임계값을 충족하는 데 필요한 트랜스크립트 수를 파악했습니다. 10,000개의 리샘플에서 얻은 이러한 임계값을 기반으로 각 데이터 세트에 대해 다양한 기본 크기와 실행 길이에 걸쳐 각각의 새로운 정보 임계값에 도달하는 데 필요한 인터뷰 수에 대한 중앙값과 5번째 및 95번째 백분위수를 계산했습니다. 5번째 및 95번째 백분위수는 이러한 새로운 정보 임계값에 정의된 포화 상태에 도달하는 데 필요한 트랜스크립트 수에 대한 비모수적 90% 신뢰 구간을 제공합니다.
While these three studies offer diverse and analytically rigorous case studies, they provide limited generalizability. To approximate population-level statistics and broaden our validation exercise, we drew empirical bootstrap samples from each of the datasets described above. The bootstrap method is a resampling technique that uses the variability within a sample to estimate the sampling distribution of metrics (in this case saturation metrics) empirically [35]. This is done by randomly resampling from the sample with replacement (i.e., an item may be selected more than once in a resample) many times in a way that mimics the original sampling scheme. For each qualitative dataset, we generated 10,000 resamples from the original sample. In addition, we randomly ordered the selected transcripts in each resample to offset any order effect on how/when new codes are discovered. For each resample, we calculated the proportion of new themes found in run lengths of two or three new events relative to a base size of four, five or six interviews. We then identified the number of transcripts needed to meet a new information threshold of ≤5% or 0%. Based on these thresholds from 10,000 resamples, for each dataset we computed the median and the 5th and 95th percentiles for number of interviews required to reach each new information threshold across different base sizes and run lengths. The 5th and 95th percentiles provide a nonparametric 90% confidence interval for the number of transcripts needed to reach saturation as defined at these new information thresholds.
각 데이터 세트에서 식별된 총 코드 수를 사용할 수 있었기 때문에 전체 데이터 세트에서 소급하여 평가한 포화와 관련된 새로운 정보 임계값에 도달하는 데 필요한 인터뷰의 중간값을 이해하기 위한 또 다른 메트릭을 제공하기 위해 한 가지 추가 계산을 수행했습니다. 이 경우, 데이터 세트의 각 실행에 대해 새로운 정보 임계값에 도달하기 위한 인터뷰 횟수가 결정되면, 그 시점까지 식별된 고유 테마의 수를 총 고유 테마의 수로 나눴습니다. 이를 통해 데이터의 각 실행에 대한 포화의 백분율 또는 정도를 제공한 다음, 도달한 포화에 대한 중앙값과 5번째 및 95번째 백분위수를 생성하는 데 사용했습니다. 그런 다음 이를 기본 크기, 실행 길이 및 새로운 정보 임계값에 걸쳐 비교할 수 있습니다. [이 과정은 제안된 프로세스의 일부가 아니라 포화 계산을 위해 제안된 접근 방식을 이해하고 검증하기 위한 추가 방법으로 포함되었습니다.]
Since we had available the total number of codes identified in each dataset, we carried out one additional calculation as a way to provide another metric to understand how the median number of interviews to reach a new information threshold related to retrospectively-assessed degrees of saturation with the entire dataset. In this case, once the number of interviews to reach a new information threshold was determined for each run of a dataset, we divided the number of unique themes identified up to that point by the total number of unique themes. This provided a percent–or degree–of saturation for each run of the data, which was then used to generate a median and 5th and 95th percentile for the degree of saturation reached. This can then be compared across base sizes, run lengths, and new information thresholds. [Note that we include this as a further way to understand and validate the proposed approach for calculating saturation, rather than as part of the proposed process.]
결과
Results
부트스트래핑 분석의 결과는 표 2, 3, 4에 데이터 세트별로 제시되어 있습니다. 각 표에는 새로운 정보 임계값이 5% 이하이고 새로운 정보가 없을 때 기준이 4, 5 또는 6이고 실행 길이가 2 및 3인 부트스트랩 분포의 중앙값과 백분위수가 표시됩니다.
The results from the bootstrapping analyses are presented by dataset, in Tables 2, 3 and 4. Each table presents median and percentiles of the bootstrap distribution using bases of 4, 5 or 6 and run lengths of 2 and 3, at new information thresholds of ≤5% and no new information.


위의 예에서 설명한 것처럼, [실행 길이]의 인터뷰 수는 주어진 새 정보 임계값에 도달하기 위한 인터뷰 수에 포함되지 않으므로 [임계값에 도달했는지 평가하는 데 필요한 총 이벤트 수]는 선택한 실행 길이에 따라 주어진 중앙값보다 두세 개 더 많은 이벤트 수입니다. 이는 위첨자 +2 또는 +3으로 표시됩니다.
Note that, as described in the example above, the number of interviews in the run length is not included in the number of interviews to reach the given new information threshold, so the total number of events needed to assess having reached the threshold is two or three more interviews than the given median, depending on the run length of choice. This is indicated by a superscript +2 or +3.
데이터세트 1(표 2)의 경우, 신규 정보 ≤5% 임계값에서 신규 정보 감소에 도달하는 데 필요한 인터뷰 횟수의 중앙값은 모든 기본 규모에 걸쳐 일정했습니다. 인터뷰 실행 길이가 2회인 경우, 새로운 정보의 감소가 관찰되기까지 필요한 인터뷰 횟수의 중앙값은 6회였습니다. 즉, 처음 4, 5, 6번의 인터뷰에서 식별된 총 고유 코드 수에 비해 7번과 8번 인터뷰에서 기여한 새로운 정보의 양은 전체의 5% 미만이었습니다. 인터뷰가 3번 진행되었을 때, 새로운 정보가 감소하기까지 필요한 인터뷰 횟수의 중앙값은 7번이었습니다. 즉, 처음 4, 5, 6번의 인터뷰에서 식별된 총 고유 코드 수에 비해 8, 9, 10번의 인터뷰가 기여한 새로운 정보의 양은 전체의 5% 미만이었습니다. 기본 크기에서 실행 길이가 2인 경우 포화는 6+2로 나타났고, 실행 길이가 3인 경우 포화는 7+3으로 관찰되었으며, 둘 다 신규 정보 ≤5% 수준에서 관찰되었다고 말할 수 있습니다. 데이터 세트의 총 주제 수를 소급하여 사용했을 때, 6~7개의 인터뷰에 걸쳐 나타난 주제 수는 78%~82%의 포화 중간값에 해당했습니다.
For Dataset 1 (Table 2), at the ≤5% new information threshold, the median number of interviews needed to reach a drop-off in new information was consistent across all base sizes. At a run length of two interviews, the median number of interviews required before a drop in new information was observed was six. This means that relative to the total number of unique codes identified in the first four, five, or six interviews, the amount of new information contributed by interviews 7 and 8 was less than or equal to 5% of the total. At a run length of three interviews, the median number of interviews required before a drop in new information was observed was seven. This means that relative to the total number of unique codes identified in the first four, five, or six interviews, the amount of new information contributed by interviews 8, 9, and 10 was less than or equal to 5% of the total. Across base sizes, for a run length of two, we would say that saturation was indicated at 6+2, while for a run length of three we would say saturation was observed at 7+3, both at the ≤5% new information level. Using the total number of themes in the dataset retrospectively, the number of themes evident across 6–7 interviews corresponded with a median degree of saturation of 78% to 82%.
새로운 정보 임계값 0%에서 포화를 나타내는 인터뷰 수 중앙값은 실행 기간에 따라 달라졌을 뿐, 기반 규모에 관계없이 다시 일관되게 나타났습니다. 필요한 인터뷰 수의 중앙값은 11+2개와 14+3개였습니다. 즉, 실행 길이 2에서는 11번의 인터뷰와 새로운 정보가 제공되지 않음을 확인하는 데 2번의 인터뷰가 더 필요했습니다. 실행 길이 3에서는 14번의 인터뷰와 새로운 정보가 없음을 확인하는 데 3번의 인터뷰가 더 필요했습니다. 11~14개의 인터뷰를 통해 드러난 주제의 수는 포화의 중간값인 87%~89%에 해당했습니다.
At the 0% new information threshold, the median number of interviews to indicate saturation were again consistent across bases sizes, varying only by the run length. The median number of interviews required were 11+2 and 14+3. In other words, at run length 2, it took 11 interviews, plus two more to confirm that no new information was contributed. At run length 3 it was 14 interviews plus three more to confirm no new information. The number of themes evident across 11–14 interviews corresponded with a median degree of saturation of 87% to 89%.
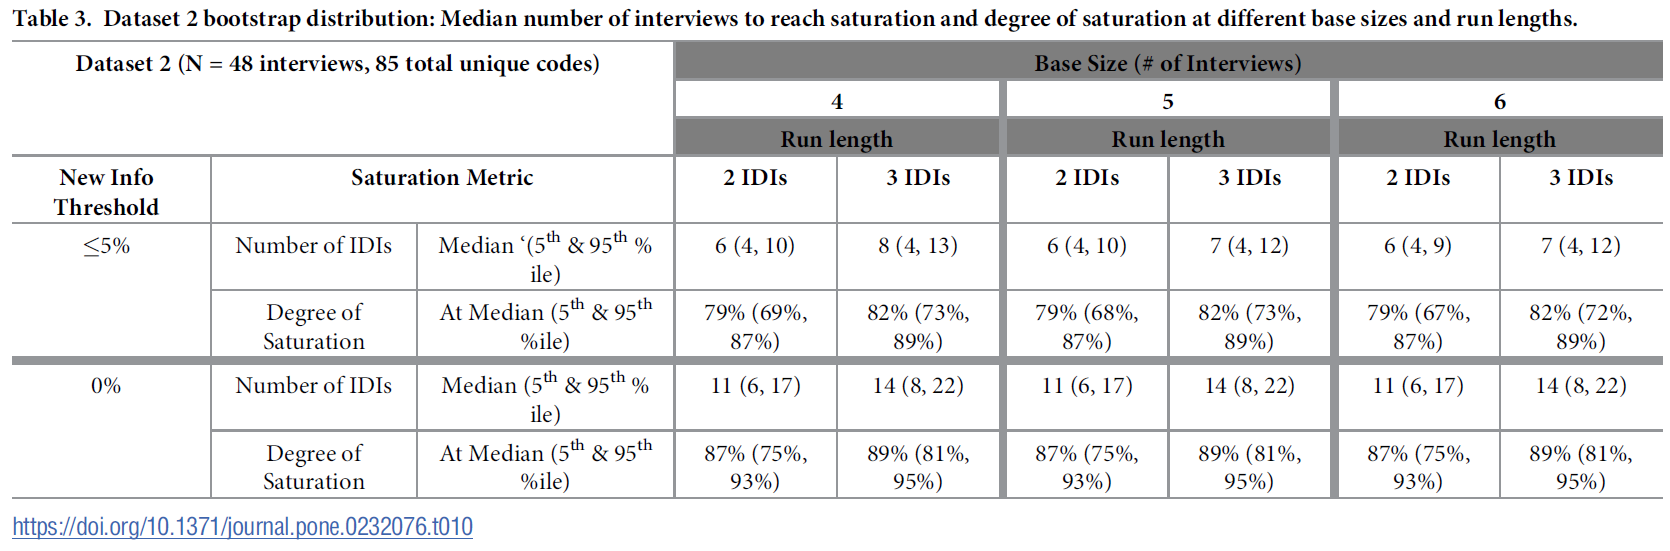
데이터셋 2의 결과는 데이터셋 1과 거의 동일했습니다(표 3). 실행 길이가 2(6+2)인 인터뷰는 6개, 실행 길이가 3(7+3 또는 8+3)인 인터뷰는 7~8개에서 포화가 나타났습니다. 6~8개의 인터뷰에 걸쳐 나타난 테마의 수는 포화의 중간값인 79%~82%에 해당했습니다. 0%의 새로운 정보 임계값에서 포화는 데이터세트 1에서와 동일한 지점인 11+2와 14+3에서 나타났으며, 모든 기본 크기에 걸쳐 일관되게 나타났습니다. 즉, 실행 길이 2를 사용한 11번의 인터뷰 중앙값 이후에는 새로운 정보가 관찰되지 않았고, 실행 길이 3을 사용한 14번의 인터뷰 이후에도 새로운 정보가 관찰되지 않았습니다. 여기에서도 전체 데이터 세트의 총 테마 수는 다르지만, 11~14번의 인터뷰에서 나타난 새로운 테마의 수는 포화의 중앙값이 87%~89%에 해당했습니다.
The results for Dataset 2 were nearly identical to Dataset 1 (Table 3). Saturation was indicated at 6 interviews at a run length of 2 (6+2) and 7–8 interviews at run length 3 (7+3 or 8+3). The number of themes evident across 6–8 interviews corresponded with a median degree of saturation of 79% to 82%. At the 0% new information threshold saturation was indicated at the same points as in Dataset 1: 11+2 and 14+3, consistent across all base sizes. In other words, no new information was observed after a median of 11 interviews using a run-length of 2, nor after 14 interviews using a run length of 3. Here again, despite a different total number of themes in the overall dataset, the number of new themes evident across 11–14 interviews corresponded with a median degree of saturation of 87% to 89%.
데이터셋 3(표 4)은 다른 데이터셋에 비해 샘플에 더 많은 변동이 있었으며, 이는 인터뷰 수 중앙값이 약간 더 높고 포화가 더 낮게 반영되었습니다. 새 정보 임계값 ≤5%에서 실행 길이 2에서 포화 상태에 도달하는 데 필요한 인터뷰 수 중앙값은 8~9개였습니다(기본 크기 4의 경우 더 높음). 실행 길이가 3인 경우 필요한 인터뷰 수 중앙값은 11~12개였습니다(기본 크기 4의 경우 이보다 높았습니다). 8~12개의 인터뷰를 통해 드러난 새로운 주제의 수는 포화의 중앙값이 62%~71%에 해당했습니다. 새로운 정보가 0%인 임계값에서는 포화가 12+2와 16+3으로 나타났으며, 기본 크기 전반에서 일관되게 나타났습니다. 12~16개의 인터뷰에 걸쳐 나타난 새로운 주제의 수는 포화의 중앙값이 69%~76%에 해당했습니다.
Dataset 3 (Table 4) contained more variation in the sample than the others, which was reflected in a slightly higher median number of interviews and a lower degree of saturation. At the ≤5% new information threshold, the median number of interviews required to reach saturation at a run length of 2 was 8–9 (higher for base size 4). At a run length of 3, the median number of required interviews was 11–12 (again higher for base size 4). The number of new themes evident across 8–12 interviews corresponded with a median degree of saturation of 62% to 71%. At the 0% new information threshold, saturation was indicated at 12+2 and 16+3, consistent across base sizes. The number of new themes evident across 12–16 interviews corresponded with a median degree of saturation of 69% to 76%.
토론
Discussion
이 백서에서는 질적 인터뷰의 귀납적 분석에서 주제별 포화를 평가하는 방법을 제시합니다. 이 방법이 심층 인터뷰 맥락에서 포화를 개념화, 평가 및 보고하는 다른 방법과 관련된 많은 한계를 극복하는 방법을 설명합니다. 이 프로세스는 데이터 수집 및 분석 과정에서 전향적으로 적용하거나 데이터 수집 및 분석이 완료된 후 후향적으로 적용할 수 있습니다. 이 방법의 가장 큰 장점은 메트릭이 유연하여 연구자가 다양한 실행 기간 및/또는 새로운 정보 임계값을 선택하여 다양한 수준의 엄격함을 선택할 수 있다는 것입니다. 마찬가지로, 이 방법을 사용하면 포화를 설명하고 보고할 때 다양한 옵션을 사용할 수 있으며 명확성과 투명성이 향상됩니다.
In this paper we present a way of assessing thematic saturation in inductive analysis of qualitative interviews. We describe how this method circumvents many of the limitations associated with other ways of conceptualizing, assessing and reporting on saturation within an in-depth interview context. The process can be applied either prospectively during the data collection and analysis process or retrospectively, after data collection and analysis are complete. A key advantage is that the metrics are flexible, affording researchers the ability to choose different degrees of rigor by selecting different run lengths and/or new information thresholds. Similarly, the method allows for different options–and greater clarity and transparency–in describing and reporting on saturation.
부트스트래핑 분석을 기반으로 몇 가지 결론을 도출할 수 있습니다. 첫 번째는 결과가 이전의 경험적 연구를 바탕으로 예상했던 범위 내에 있다는 것입니다. 5% 이하의 새로운 정보 임계값을 사용한 결과, 일반적으로 6~7개의 인터뷰로 균질한 표본에서 대부분의 주제를 포착할 수 있습니다(6개의 인터뷰로 80%의 포화에 도달). 또한 분석 결과, 이 옵션의 상위 범위(95번째 백분위수)에서는 11~12개의 인터뷰가 필요할 수 있으며, 기존 문헌에 따르면 일반적으로 더 높은 포화에 도달하기 위해서는 12개의 인터뷰가 필요하다고 합니다.
Based on the bootstrapping analyses we can draw several conclusions. The first is that the results are within the range of what we would have expected based on previous empirical studies. Using the ≤5% new information threshold, our findings indicate that typically 6–7 interviews will capture the majority of themes in a homogenous sample (6 interviews to reach 80% saturation). Our analyses also show that at the higher end of the range for this option (95th%ile) 11–12 interviews might be needed, tracking with existing literature indicating 12 interviews are typically needed to reach higher degrees of saturation.
또한 이 프로세스의 적용에 도움이 되는 다른 교훈을 얻을 수도 있습니다:
We can also draw other lessons to inform application of this process:
- [기본 규모]는 결과에 거의 영향을 미치지 않는 것으로 보입니다. 이는 효율성 측면에서 중요한 사항입니다. 이번 연구 결과가 다른 상황에서도 유효하다면, 기본 인터뷰 규모를 4회로 설정하는 것으로 충분하다는 것을 시사합니다. 실질적으로 이는 6번의 인터뷰(기본 4번, 실행 2번) 후에 포화를 평가해야 한다는 것을 의미합니다. 실시간으로 데이터를 분석하는 경우, 이 초기 평가 결과에 따라 추가 인터뷰가 필요한지 여부를 결정할 수 있습니다.
- Base size appears to have almost no effect on the outcome. This is important from an efficiency perspective. If our findings hold true in other contexts, it suggests that using a default base size of four interviews is sufficient. In practical terms, this implies that saturation should initially be assessed after six interviews (four in the base, and two in the run). If analyzing data in real time, the results of this initial assessment can then determine whether or not more interviews are needed.
- 예상대로 [실행 시간]은 결과에 영향을 미칩니다. 실행 길이가 길수록 포화 상태에 도달하기 위해 더 많은 수의 인터뷰가 필요합니다. [실행 길이]가 미치는 효과의 크기는 새 정보 임계값 ≤5%를 사용하는 경우 가장 작거나 매우 미미합니다. 이 발견의 실질적인 의미는 연구자가 더 [긴 실행 길이(예: 3회 이상의 인터뷰)]를 선택하여 포화에 대한 보다 [보수적인 평가를 생성]할 수 있다는 것입니다.
- Run length has an effect on the outcome, as one would expect. The longer the run length, the greater number of interviews required to reach saturation. The size of run length effect is smallest–very minimal–if employing the ≤5% new information threshold. The practical implication of this finding is that researchers can choose a longer run length–e.g., three interviews (or more)–to generate a more conservative assessment of saturation.
- [선택한 새로운 정보 임계값]은 예상대로 포화가 표시되는 지점에 영향을 미칩니다. 새로운 정보 임계값이 낮을수록, 즉 새로운 정보를 인식하는 데 더 보수적으로 허용할수록 포화 상태에 도달하기 위해 더 많은 인터뷰가 필요합니다. 응용적인 관점에서 볼 때, 이 결과는 연구자가 원하는 경우 [더 엄격한 새로운 정보 임계값(예: 0%)을 선택]하면 포화를 [더 보수적으로 평가]할 수 있다는 확신을 가질 수 있다는 점에서 중요한 의미를 갖습니다.
- The new information threshold selected affects the point at which saturation is indicated, as one would expect. The lower the new information threshold–and therefore the more conservative the allowance for recognizing new information–the more interviews are needed to achieve saturation. From an applied standpoint this finding is important in that researchers can feel confident that choosing a more stringent new information threshold–e.g., 0%—will result in a more conservative assessment of saturation, if so desired.
물론 이 접근 방식에는 여전히 한계가 있습니다. 이 접근법은 [귀납적 주제 분석](특정 실제 이슈나 문제에 대한 비교적 좁은 질문에 답하기 위한 연구)을 염두에 두고 개발되었으며, 부트스트래핑 분석에 사용된 데이터 세트는 이 프레임워크 내에서 생성 및 분석되었습니다. 다른 인식론적 또는 현상학적 관점을 가진 질적 연구에 이 접근법을 적용할 수 있는지는 아직 검증되지 않았습니다. 이 방법의 또 다른 잠재적 한계는 [코드북 구조]와 관련이 있습니다. 귀납적 주제 분석을 수행할 때 연구자는 적절한 코드북 구성 체계를 결정해야 합니다(포화와 관련된 논의는 Hennink 외. [23]을 참조하세요). 저희는 [단일 계층 코드북]을 대상으로 이 방법을 테스트했지만, 질적 연구자들은 [계층적 코드북]을 만드는 경우가 많습니다. 기본("상위") 코드와 구성 보조("하위") 코드가 있는 2계층 구조가 일반적인 형태이지만, 연구자는 더 높은 수준의 메타 주제를 식별하고 찾고자 할 수도 있습니다(예: Hagaman과 Wutich [19]). 우리를 포함한 모든 포화 평가 방법의 경우, 연구자는 어느 수준에서 주제/코드를 식별하고 포함할지 결정해야 합니다. 귀납적 주제 분석의 경우, 이는 특정 분석 목표에 필요한 코딩의 세분성 정도와 연구팀이 연구 결과를 보고할 때 포화를 어떻게 논의할 것인지에 따라 달라지는 주관적인 결정입니다. 즉, 연구자는 이 접근 방식을 사용하여 서로 다른 수준의 코딩 세분성을 포함하는 두 개 이상의 코드북에 대한 포화 분석을 실행하고 보고할 수 있습니다.
There are, of course, still limitations to this approach. It was developed with applied inductive thematic analyses in mind–those for which the research is designed to answer a relatively narrow question about a specific real-world issue or problem–and the datasets used in the bootstrapping analyses were generated and analyzed within this framework. The applicability of this approach for qualitative research with a different epistemological or phenomenological perspective is yet untested. Another potential limitation of this method relates to codebook structure. When conducting an inductive thematic analysis, researchers must decide on an appropriate codebook organizational scheme (see Hennink et al. [23] for discussion on this as it relates to saturation). We tested our method on single-tier codebooks, but qualitative researchers often create hierarchical codebooks. A two-tier structure with primary (“parent”) codes and constituent secondary (“child”) codes is a common form, but researchers may also want to identify and look for higher-level, meta-themes (e.g., Hagaman and Wutich [19]). For any method of assessing saturation, including ours, researchers need to decide at which level they will identify and include themes/codes. For inductive thematic analyses this is a subjective decision that depends on the degree of coding granularity necessary for a particular analytic objective, and how the research team wants to discuss saturation when reporting study findings. That said, a researcher could, with this approach, run and report on saturation analyses of two or more codebooks that contain differing levels of coding granularity.
결론
Conclusion
Tran과 동료들[24]은 "연구자는 자신이 발견한 것에 대한 정보만 가지고 있기 때문에"(17페이지) 포화점을 결정하는 것이 어려운 일이라고 정확하게 지적합니다. 그들은 또한 귀납적 연구의 중단점은 일반적으로 "연구자의 판단과 경험"에 의해 결정된다고 주장합니다. 우리는 이러한 주장을 인정하고 동의합니다.
Tran and colleagues [24] accurately point out that determining the point of saturation is a difficult endeavor, because “researchers have information on only what they have found” (pg. 17). They further argue that the stopping point for an inductive study is typically determined by the “judgement and experience of researchers”. We acknowledge and agree with these assertions.
엄격성, 정확성, 신뢰도의 수준을 선택하고 해석하는 것은 주관적인 작업입니다. 예를 들어, 정량적 연구자가 충분히 큰 효과 크기 또는 충분히 작은 p-값으로 받아들이는 것은 [주관적인 판단]이며 특정 연구 분야의 관습에 근거한 것입니다. 연구자가 통계 결과를 보고하고 해석하는 방법도 마찬가지입니다. P값은 절대값(예: p = .043) 또는 일반적으로 사용되는 몇 가지 증분값(예: p < .05, p < .01 등)으로 표현할 수 있습니다. 마찬가지로, 1.2의 승산비는 통계적으로 유의미할 수 있지만 실제 의미에서 유의미한지 여부는 전적으로 해석의 여지가 있습니다.
Selecting and interpreting levels of rigor, precision, and confidence is a subjective enterprise. What a quantitative researcher accepts, for example, as a large enough effect size or a small enough p-value is a subjective determination and based on convention in a particular field of study. The same can be said for how a researcher chooses to report and interpret statistical findings. P-values can be expressed either in absolute terms (e.g., p = .043) or in several commonly used increments (e.g., p < .05, p < .01, etc.). Likewise, while an odds ratio of 1.2 may be statistically significant, whether or not it’s meaningful in a real-world sense is entirely open to interpretation.
우리는 주제별 포도를 평가하고 보고할 때 이와 유사한 유연성과 투명성을 추구하고 있습니다. 연구자들에게 데이터 수집 중 또는 수집 후에 포화를 쉽게 계산할 수 있는 방법을 제공했습니다. 또한 이 방법을 통해 연구자는 자신의 해석과 결론이 주제별 포화에 도달한 데이터 세트에 근거한 것이라는 확신을 얼마나 갖고 싶은지에 따라 프로세스의 구성 요소인 기본 크기, 실행 길이, 새로운 정보 임계값의 수준을 다르게 선택할 수 있습니다. 연구자들이 이 방법을 유용하게 활용하고, 다른 연구자들이 다양한 연구 집단과 맥락에서 추출한 다양한 유형의 데이터세트에 대해 이 방법을 실증적으로 테스트하여 우리의 연구를 발전시켜 나가기를 바랍니다.
We are advocating for similar flexibility and transparency in assessing and reporting on thematic saturation. We have provided researchers with a method to easily calculate saturation during or after data collection. This method also enables researchers to select different levels of the constituent elements in the process–i.e., Base Size, Run Length and New Information Threshold–based on how confident they wish to be that their interpretations and conclusions are based on a dataset that reached thematic saturation. We hope researchers find this method useful, and that others build on our work by empirically testing the method on different types of datasets drawn from diverse study populations and contexts.
A simple method to assess and report thematic saturation in qualitative research
PMID: 32369511
PMCID: PMC7200005
DOI: 10.1371/journal.pone.0232076
Abstract
Data saturation is the most commonly employed concept for estimating sample sizes in qualitative research. Over the past 20 years, scholars using both empirical research and mathematical/statistical models have made significant contributions to the question: How many qualitative interviews are enough? This body of work has advanced the evidence base for sample size estimation in qualitative inquiry during the design phase of a study, prior to data collection, but it does not provide qualitative researchers with a simple and reliable way to determine the adequacy of sample sizes during and/or after data collection. Using the principle of saturation as a foundation, we describe and validate a simple-to-apply method for assessing and reporting on saturation in the context of inductive thematic analyses. Following a review of the empirical research on data saturation and sample size estimation in qualitative research, we propose an alternative way to evaluate saturation that overcomes the shortcomings and challenges associated with existing methods identified in our review. Our approach includes three primary elements in its calculation and assessment: Base Size, Run Length, and New Information Threshold. We additionally propose a more flexible approach to reporting saturation. To validate our method, we use a bootstrapping technique on three existing thematically coded qualitative datasets generated from in-depth interviews. Results from this analysis indicate the method we propose to assess and report on saturation is feasible and congruent with findings from earlier studies.
'Articles (Medical Education) > 의학교육연구(Research)' 카테고리의 다른 글
| 샌프란시스코 연구 평가 선언(Declaration on Research Assessment, DORA) (0) | 2023.06.30 |
|---|---|
| 상아탑 대 실천-지향 연구의 미신: 의학교육 무작위 연구의 체계적 문헌고찰(Med Educ, 2020) (0) | 2023.05.04 |
| 인터뷰 기반 연구에서 표본 크기 충분성의 특성화 및 정당화: 15년간 질적 건강연구의 체계적 문헌고찰(BMC Med Res Methodol. 2018) (0) | 2023.03.17 |
| 코드 포화 대 의미 포화: 얼마나 많은 인터뷰가 필요한가? (Qual Health Res. 2017) (0) | 2023.03.17 |
| 질적연구에서 포화를 위한 표본 수: 실증 시험의 체계적 문헌고찰(Soc Sci Med. 2022) (0) | 2023.03.17 |