편향되지 않고, 신뢰할 수 있고, 타당한 학생강의평가도 여전히 불공정할 수 있다 (Assessment & Evaluation in Higher Education, 2020)
Unbiased, reliable, and valid student evaluations can still be unfair
Justin Esarey and Natalie Valdes

서론
Introduction
학생 강의 평가는 고등교육의 교수들이 얼마나 잘 가르치고 있는지를 평가하기 위해 사용되어야 하는가? 학자들이 학생 평가의 유용성에 대해 토론할 때, 일반적으로 SET가 유효하고 신뢰할 수 있고 편향되지 않은 방식으로 강사의 자질을 측정하는지 여부에 대한 논의의 초점이 맞춰진다. 예를 들어, 많은 연구가 SET가 여성 강사에 대해 편중되어 있는지 여부를 조사했습니다. 편파적이거나 잘못된 SET를 사용하여 인사 결정을 내리는 데 명백한 문제가 있기 때문에 문헌은 양적이면서도 불일치하다. 하지만 SET가 이러한 문제로부터 자유로워지면 어떻게 될까요? 이 경우, SET 점수는 채용할 직업 후보자를 선택하는 데 있어서, 또는 교직원에게 종신 재직권을 부여해야 하는지 여부를 결정하는 데 있어서 타당한 근거가 되는가?
Should student evaluations be used to assess how well faculty in higher education are teaching? When scholars debate the utility of student evaluations of teaching (SETs), the discussion typically centres on whether SETs measure an instructor’s quality in a valid, reliable and unbiased way. For example, many studies have examined whether SETs are biased against female instructors (Langbein 1994; Andersen and Miller 1997; Martin 2016; Mitchell and Martin 2018; Mengel, Sauermann, and Zölitz 2019). The literature is both voluminous and discordant, perhaps because there are obvious problems with using biased or invalid SETs to make personnel decisions. But what if SETs are free from these problems? In that case, are SET scores a sound basis for choosing which job candidate to hire or whether a faculty member should be granted tenure?
이 기사에서, 우리의 컴퓨터 시뮬레이션은 SET를 사용하여 가난한 교사를 식별하면 [경험적 연구에 의해 지원되는 가장 낙관적인 시나리오]에서조차 [허용할 수 없을 정도로 높은 오류율]을 야기할 수 있음을 보여준다. 즉, SET가 (a) 학생의 학습 및 지도의 베스트 프랙티스와 어느정도 상관이 있고, (b) 신뢰성이 있고, (c) 편향되지 않았더라도, SET가 교직원의 교육 성과를 평가하기 위해 사용되는 일반적인 방법은 SET와 강사 간의 분포에 관한 합리적인 가정 하에서 불공평하다. 이는 [SET 점수]와 [강사 자질] 간의 관계가 상당히 부정확하기 때문에 발생합니다. 둘 사이에 상당한 상관관계가 있는 경우에도 마찬가지입니다. 이러한 부정확성은 SET 점수에 대한 본질적으로 무작위적이고 특이한 영향(예: 성격이나 외모)에서 비롯될 수 있으며, 지도와 관련이 없는 점수에 대한 체계적인 영향(예: 특정 성별이나 인종의 교원에 대한 편견)에서 비롯될 수 있다. 그러나 체계적인 편견이 없는 경우에도 SET 점수의 특이적 변화로 인해 발생하는 소음은 SET를 사용하여 교직원의 교육에 대한 올바른 판단을 하는 우리의 능력을 방해합니다.
In this article, our computational simulation shows that using SETs to identify poor teachers can result in an unacceptably high error rate even under the most optimistic scenarios supported by empirical research. That is, even if it is correct that SETs are (a) moderately correlated with student learning and/or instructional best practices, (b) reliable and (c) unbiased, common ways that SETs are used to evaluate faculty teaching performance are unfair under reasonable assumptions about the distribution between SETs and instructor quality. This occurs because there is considerable imprecision in the relationship between SET scores and instructor quality even when there is substantial correlation between the two. This imprecision can come from essentially random and idiosyncratic influences on SET score (such as personality or appearance), or it can come from systematic influences on those scores that are not related to instruction (e.g. bias against faculty members of a certain gender or race). But even when there are no systematic biases, the noise created by idiosyncratic variation in SET score interferes with our ability to use SETs to make correct judgements about a faculty member’s teaching.
컴퓨터 시뮬레이션을 사용하는 이유는 SET 점수가 이상적인 조건에서 교직원의 교육에 대한 행정적 판단에 매핑될 때 어떤 일이 일어나는지 조사할 수 있기 때문입니다. 우리의 접근법은 산업심리학에서 나온 선별과 평가의 오래된 이론 모델과 유사하다. 결과가 분포 가정에 지나치게 의존하지 않도록 원시 점수 대신 상관 백분위수 순위를 시뮬레이션하는 정규 연결사를 사용합니다. copula는 개별 한계 분포 함수를 공동 분포 함수에 연결하는 함수이며, 보다 구체적으로 '표준 균일 일변량 여유를 갖는 다변량 df [분포 함수]'이다(Hofert 2018, 페이지 5–6). 백분위수 순위는 원시 SET 점수 분포에 관계없이 항상 균일하게 분포되므로 다양한 학생 평가 도구와 점수 척도로 많은 대학을 모델링하는 데 더 나은 선택이다. 그러나 특정 한계 분포와 상관 계수는 SET 점수 및 교육 품질의 공동 분포를 고유하게 결정하지 않는다. 따라서 우리의 결론은 합리적으로(보편적이지는 않지만) 일반화할 수 있다고 믿는 일부 분포 가정에 여전히 구속된다. 이 점은 '방법론' 섹션과 '결론'에서 더 자세히 설명되며, 여기서 교직원과 관리자가 SET 점수를 실제로 사용하는 경우의 결과에 대해 논의한다.
We use computational simulation because it allows us to examine what happens when SET scores are mapped into administrative judgements about faculty teaching under ideal conditions. Our approach is similar to venerable theoretical models of screening and assessment from industrial psychology (Taylor and Russell 1939; Naylor and Shine 1965; Cascio 1980; Owen and Li 1980). To avoid our results being overly dependent on distributional assumptions, we use normal copulas that simulate correlated percentile rankings instead of raw scores. A copula is a function that connects individual marginal distribution functions to a joint distribution function, and more specifically is ‘a multivariate df [distribution function] with standard uniform univariate margins’ (Hofert 2018, pp. 5–6). Percentile rankings are always uniformly distributed regardless of the distribution of raw SET scores and are therefore a better choice for modelling many universities with different student evaluation instruments and scoring scales. However, specific marginal distributions and a correlation coefficient do not uniquely determine a joint distribution of SET scores and instructional quality; our conclusions are therefore still bound to some distributional assumptions that we believe are reasonably (though not universally) generalizable. This point is discussed further in the ‘Methodology’ section and in our ‘Conclusion’, where we discuss the consequences for practical employment of SET scores by faculty and administrators.
다양한 상관관계를 가진 SET 점수 및 교직원 품질 백분위수를 시뮬레이션한 후 여러 평가 절차에서 시뮬레이션된 점수를 사용합니다. 구체적으로는 다음 사항을 조사합니다.
We simulate SET scores and faculty quality percentiles with varying correlation, then use the simulated scores in several assessment procedures. Specifically, we examine:
- SET 점수를 통한 교직원의 쌍별 비교. 이는 교육 실적에 따른 취업 지원자의 비교 또는 종신 재직권 교수와 최근의 성공 사례의 교육 기록을 비교한 것이다.
- 개별 교수의 SET 점수와 모든 교직원의 SET 점수의 전체 모집단의 비교. 이는 동료에 비해 성적이 낮은 교수진(예를 들어 점수가 특정 백분위수 순위 이하)이 테뉴어 케이스 또는 기타 체계적인 검토의 일부로 행정처분을 위해 식별되는 절차를 반영한다.
- pairwise comparisons of faculty via SET scores. This mirrors the comparison of job candidates on the basis of their teaching performance or the comparison of a faculty member up for tenure to the teaching record of a recent (un)successful case.
- comparison of an individual professor’s SET scores to the overall population of SET scores from all faculty members. This mirrors a procedure where faculty members who are under-performing relative to their peers (e.g. whose scores are below a certain percentile ranking) are identified for administrative action as part of a tenure case or other systematic review.
SET 점수와 교직원 교육 품질 사이의 상관관계가 ρ가 약 0.4인 경우(즉, 대체로 경험적 문헌에 의해 지지받는 가장 높은 값)인 상황에서조차, SET 점수의 큰 차이(30% 포인트까지)로 인하여 최고의 교수자를 신뢰성 있게 식별하지 못한다. 게다가 SET 점수가 20백분위 이하인 교직원의 4분의 1 이상이, 실제로 시뮬레이션의 중간값 교직원의 교직원에 비해 더 잘 가르치고 있습니다. SET 점수가 매우 높은 사람도 형편없는 교사가 될 수 있습니다. 95번째 백분위수를 초과하는 SET 점수를 받은 교수는 거의 19%가 중간 교수보다 더 잘 가르치지 못합니다. 이러한 결과는 이변량 정규 분포를 사용하여 SET 점수 및 교직원 품질을 시뮬레이션하여 분석을 반복할 때 확인됩니다. 이 분석의 의미는 교수의 수업instruction에 기반하여 공정하고 정확한 인사 결정을 내리려면 SET 점수보다 학생의 학습이나 지도의 베스트 프랙티스에 실질적으로 더 관련된 교육 성과 측정이 필요하다는 것입니다.
Even when the correlation between SET scores and faculty instructional quality is ρ ≈ 0.4, roughly the largest value supported by empirical literature (e.g. Cohen (1981) finds an average correlation of 0.43 between overall SET score and student learning), a large difference in SET scores (even as much as 30 percentile points) does not reliably identify the best teacher in a pairwise comparison of simulated faculty members. Moreover, over one quarter of faculty with SET scores at or below the 20th percentile are actually better at teaching than the median faculty member in our simulation. Even those with exceptionally high SET scores can be poor teachers: nearly 19% of those with SET scores above the 95th percentile are no better than the median professor at teaching. These findings are confirmed when we repeat our analysis using a bivariate normal distribution to simulate SET scores and faculty quality. The implication of our analysis is that making fair, accurate personnel decisions based on faculty instruction requires a measure of teaching performance that is substantially more related to student learning or instructional best practices than SET scores alone.
우리 결과에 근거해, 대학내에서의 SET의 사용 방법에 대해 3개의 제언을 실시합니다.
- 첫째, 목적이 무엇이든 회귀 조정 또는 일치된 하위 표본 분석을 통해, 비교육적instructional 요인(즉, 편향)에 의해 설명되는 SET 점수의 체계적 편차를 제거한 후 이러한 점수를 사용할 것을 권고한다. 이 조정은 평가 점수와 교육의 질 사이의 상관관계를 증가시켜 본질적으로 이 관계의 부정확한 원인을 걸러내고, 따라서 우리의 시뮬레이션에 따르면 불공정한 결정의 가능성을 감소시킨다. 단, 이 절차에서는 SET 점수에 대한 특이적 영향에 의해 발생하는 노이즈를 제거할 수 없습니다. 따라서 우리는 또한 SET 점수만으로는 오해의 소지가 있을 때 독립 평가자, 학생 인터뷰, 전문가에 의한 교수 관찰, 교재 동료 검토 및 SET 점수를 조합하여 교직원의 교수 능력을 훨씬 더 정확하게 파악할 수 있다고 믿는다. 중요한 것은, 이러한 개별적인 조치 각각에 노이즈가 있거나 결함이 있는 경우에도 마찬가지라는 것입니다.
- 우리는 이러한 여러 형태의 평가를 평균화하는 것이 각각의 독특한 변화를 상쇄시켜 평균 평가와 교직원의 실제 교육 성과 사이의 부정확성을 더욱 감소시킬 수 있다는 것을 보여준다. 교육 품질의 여러 척도를 취득하는 것은 비용이 많이 들기 때문에 SET는 교육에 대한 보다 포괄적인 평가가 필요한 교사를 특정하기 위한 저비용 메커니즘으로 기능할 수 있습니다.이렇게 파악된 많은 교직원이 우수한 교사가 될 것이라는 것을 이해하고 있습니다.
- 마지막으로, 어떠한 목적으로든 SET 점수에 과도하게 의존하는 경우 주의를 기울일 것을 권장합니다. 이러한 유용성은 일반적으로 관리자 또는 교수진에게 알려지지 않은 SET와 강사 품질 간의 공동 분포 특성에 따라 달라질 수 있음을 보여준다. 우리는 이 마지막 요점이 교육을 평가할 때 여러 평가 메커니즘(SET 점수 포함, 이에 한정되지 않음)을 사용할 필요성을 더욱 강조한다고 믿는다.
Based on our results, we make three recommendations concerning how SETs should be used within universities.
- First, we advise removing any systematic variance in SET scores explained by non-instructional factors (i.e. biases) via regression adjustment or matched subsample analysis before using these scores for any purpose (as illustrated by Nargundkar and Shrikhande 2014; see also Benton and Li 2017, pp. 3–4). This adjustment increases the correlation between evaluation scores and teaching quality, in essence filtering out a source of imprecision in this relationship and therefore reducing the chance of an unfair decision according to our simulations. However, this procedure cannot remove the noise created by idiosyncratic influences on SET scores. Thus, we also believe that a combination of independent evaluators, interviews with students, teaching observations by experts, peer review of instructional materials, and SET scores can give a much more accurate picture of a faculty member’s teaching proficiency when SET scores alone would be misleading. Importantly, this is true even when each of these individual measures is noisy or flawed.
- We show that averaging these multiple forms of evaluation can allow idiosyncratic variation in each one to cancel out, resulting in further reduction of imprecision between the averaged assessment and a faculty member’s true teaching performance. Because obtaining multiple measures of instructional quality is expensive, we think that SETs could serve as a low-cost mechanism for identifying faculty in need of this more comprehensive assessment of their teaching–with the understanding that many faculty so identified will be excellent teachers.
- Finally, we advise caution in over-reliance on SET scores for any purpose: we show that their usefulness can depend on characteristics of the joint distribution between SETs and instructor quality that will typically be unknown to administrators or faculty. We believe this final point further underscores the need to use multiple assessment mechanisms (including but not limited to SET scores) when evaluating teaching.
배경
Background
본 연구는 SET의 가치에 대한 평가에서 크고 분할된 문헌을 다루지만, 기본적으로는 SET 점수의 타당성, 신뢰성 및 (무)편향성에 초점을 맞추고 있다는 점에서 통합된다. 다수의 연구에서는 SET를 긍정적으로 평가하는데, 한 41개 연구의 메타 분석은 '일반 과정과 강사 차원이 학생의 성취도와 상당히 강하게 관련되어 있다는 것을 비교적 확신할 수 있다' 그리고 '소견은 다른 학생, 강사, 기관 및 주제 영역에 일반화될 수 있다'고 주장한다. Feldman(1989)에 의한 동일한 데이터의 재분석은 이러한 결론을 대체로 확인시켜 준다. Herbert Marsh의 오랜 연구 기록은 대부분(전부는 아니지만) Marsh가 개발한 SEQ(Student Evaluation of Educational Quality)은 신뢰성과 타당성을 조사하여 SET의 특성을 다음과 같이 주장한다.
Our study enters a literature that is both large and divided in its assessment of the value of SETs, but essentially united in that its focus is on the validity, reliability, and (un)biasedness of SET scores as measures of faculty teaching performance. In favour of SETs, an influential meta-analysis combining the findings of 41 empirical studies argues that ‘we can be relatively certain that the general course and instructor dimensions relate quite strongly to student achievement’ (Cohen 1981, p. 298) and that the ‘findings can be generalized to different students, instructors, institutions, and subject matter areas’ (p. 305). Re-analysis of the same data by Feldman (1989) largely confirms these conclusions. A long record of scholarship by Herbert Marsh (summarized in Marsh 1984, 1987; Marsh and Roche 1997), which mostly (but not exclusively) examines the reliability and validity of the Student Evaluation of Educational Quality (SEEQ) developed by Marsh (1982), argues that SETs are:
- (a) 다차원
- (b) 신뢰성 및 안정성
- (c) 주로 교육되는 과정이 아닌 과정을 가르치는 강사의 지도의 기능
- (d) 효과적인 교육의 다양한 지표에 대해 상대적으로 유효하다.
- (e) 잠재적 편견으로 가정된 다양한 변수에 상대적으로 영향을 받지 않는다.
- (f) 교육의 효율을 향상시키는 데 도움이 되다
- (a) multidimensional;
- (b) reliable and stable;
- (c) primarily a function of the instruction of the instructor who teaches a course rather than the course that is taught;
- (d) relatively valid against a variety of indicators of effective teaching;
- (e) relatively unaffected by a variety of variables hypothesized as potential biases… and
- (f) useful in improving teaching effectiveness (Marsh and Roche 1997, p. 1187).
이러한 발견은 나르군드카르와 쉬리칸데(2012)의 독립 연구에서도 확인되었다. 이와 함께 Benton과 Li는 IDEA가 제작한 SET의 교육 등급은 '학습자 및 교사 행동에 대한 외부 학생 등급과 긍정적인 상관 관계'와 함께 학생들의 시험 성적도 보고했습니다. 이러한 등급은 또한 Marsh(1982)가 만든 SET에서 보고된 것과 유사한 학생의 숙련도에 해당하는 여러 차원으로 구분된다. 일반적으로 경험적 연구는 [학생 학습]과 [SET 평정] 사이의 상관관계를 최대 ρ = 0.4 정도로 보고한다.
These findings were confirmed in an independent study by Nargundkar and Shrikhande (2012). Along the same line, Benton and Li (2017, pp. 7–8) reports that student ratings of instruction on a SET produced by IDEA ‘correlate positively with external student ratings of learner and teacher behaviours’ as well as student performance on exams (Benton, Duchon, and Pallett 2013). These ratings also break into multiple dimensions that correspond to student proficiencies (Li et al. 2016) similar to those reported for the SET created by Marsh (1982). Generally, empirical studies report correlations between student learning and SET ratings of around ρ ≈ 0.4 at most.
반면에, 많은 다른 연구들은 SET가 학생의 학습이나 강사의 질을 측정하지 않으며, 성과와 상관없이 체계적으로 일부 그룹에 편향될 수 있다고 주장해왔다. Utl, White, Gonzalez(2017)가 Cohen(1981)과 Feldman(1989)의 데이터를 재분석한 결과, [null 결과는 무시]되고, [과장된 긍정적인 결과를 가진 소규모 연구]만 발표되는 경향에 영향을 받는다는 것을 발견했다. 30개 이상의 수업 섹션을 포함하는 SET 연구만 조사하면 학생 등급과 학생 학습 간의 상관관계가 50% 이상 감소하고, 나중에 발표된 SET 연구를 포함하면 이 상관관계는 최대 ρ = 0.1까지 떨어진다(표 4 참조). Nargundkar와 Shrikhande(2014)는 Marsh의 SET 도구의 유효성을 확인하지만, SET 점수는 학급 규모, 강사 성별, 교육 과정 유형과 같은 비교육적 요인에 의한 일부 내재적 편견을 반영한다. 우리 분야(정치학)에서의 SET에 대한 연구는 특히 강사 성별이 코스 평가에 미치는 영향에 초점을 맞추고 있으며, 코스의 다른 측면이 동등하더라도 여성이 남성보다 낮은 SET 점수를 받는다는 것을 반복적으로 발견해 왔다. 이 연구결과는 여성 교수자에 대한 편견을 발견했지만, 이후 대규모 학제 간 연구에서는 커리어의 초기에서만 그렇다는 것으로 확인되었다.
On the other hand, many other studies have argued that SETs do not measure student learning or instructor quality and may be systematically biased against some groups irrespective of merit. Uttl, White, and Gonzalez (2017) re-analyse the data from Cohen (1981) and Feldman (1989) and find that their results are influenced by the tendency for small studies with exaggeratedly positive results to be published while null results are ignored (Schwarzer, Carpenter, and Rücker 2015, chapter 5; see also Sterling 1959; Sterling, Rosenbaum, and Weinkam 1995; Franco, Malhotra, and Simonovits 2014). When examining only those SET studies that included 30 or more class sections, the correlation between student ratings and student learning falls by 50% or more (see Table 3 in Uttl, White, and Gonzalez 2017); when including SET studies published later, this correlation falls even further to at most ρ ≈ 0.1 (see Table 4). While Nargundkar and Shrikhande (2014) confirm the validity of Marsh’s (1982, p. 55) SET instrument, they also note that SET scores ‘reflect some inherent biases due to noninstructional factors’ (p. 55) such as class size, instructor gender, and the type of course being taught. Work on SETs in our home discipline (of political science) has been particularly focused on the effect of instructor gender on course evaluations, repeatedly finding that women receive lower SET scores than men even when the other aspects of the course are equivalent (Langbein 1994; Andersen and Miller 1997; Martin 2016; Mitchell and Martin 2018). This finding was partially confirmed in a large cross-disciplinary study by Mengel, Sauermann, and Zölitz (2019), who found bias against female instructors but only against those early in their career.
고용과 종신 재직에 대한 결정을 내리기 위해 무효, 신뢰성이 없거나 편향된 학생 평가를 사용하는 것은 분명히 학생과 교수진 모두에게 해가 된다. 대학이 학생의 학습이나 지도의 베스트 프랙티스를 추적하지 않는 SET를 채용, 재직 및 승진 과정의 일부로 사용할 경우, 그들은 성과 대신 무작위 기회에 따라 중요한 결정을 내릴 수 있습니다. 설상가상으로, 편향된 SET는 소수집단 배경의 교수자에게 불이익이 되거나, [인기 없는 필수 과목]을 가르치는 교수에 대한 처벌punish이 될 수 있다. 이것이 중요한 문제라는 것은 인정하지만, 다른 질문을 합니다. SET가 유효하고 신뢰할 수 있으며 편견이 없다면 어떻게 될까요? 뚜렷한 편견이 없고 강사의 질과 중간 정도의 상관관계가 있는 SET 점수는 교직원의 교육 성과를 판단하는 공정한 기준인가? 이 질문에 대한 대답이 '아니오'인 경우, 일반적으로 인식되는 것보다 SET 사용에 더 큰 문제가 있습니다.
Using invalid, unreliable or biased student evaluations to make decisions about hiring and tenure is obviously harmful to students and faculty alike. If universities use SETs that do not track student learning or instructional best practices as a part of their hiring, tenure, and promotion process, they may make important decisions on the basis of random chance instead of merit. Even worse, biased SETs could disadvantage faculty from underrepresented minority groups or punish faculty members who teach unpopular required courses. While we agree that this is an important problem, we ask a different question: if SETs are valid, reliable, and unbiased, what then? Are SET scores without demonstrable bias and moderately correlated with instructor quality a fair basis on which to judge a faculty member’s teaching performance? If the answer to this question is ‘no,’ there is a much bigger problem with the use of SETs than is commonly recognized.
방법론
Methodology
SET 점수의 신뢰성, 타당성, 편중성을 교육 능력의 척도로 경험적으로 평가하는 것이 아니라 경험적 문헌에 의해 뒷받침될 수 있는 가장 낙관적인 조건을 가정하고 대학 교직원 평가 및 관리를 위한 도구로서 SET 점수를 사용한 결과를 연구한다.
- 첫째, 전체 강사 SET 등급이 코스 내의 실제 교육 품질(예: 학생 학습 및/또는 교육 모범 사례)과 중간 정도 상관된다고 가정합니다. 문헌에 보고된 가장 높은 상관관계는 ρ 0 0 0.4 정도이므로 이 상관관계 수준을 연구의 기준으로 사용한다. 우리는 또한 강사의 클래스 평균 SET 점수가 완벽하게 신뢰할 수 있다고 가정한다(즉, 강사의 클래스 평균 SET 점수는 항상 동일하므로 완벽하게 알려져 있다). 이는 다수의 클래스 평균 SET 점수의 평균을 사용하여 교직원을 평가하거나 클래스 평균 SET 점수가 완벽하게 안정되어 있다고 가정하는 것과 같다.
- 둘째, 관리자가 SET 점수를 전문가가 권장하는 신중하고 현명한 방법으로 사용하고 있다고 가정합니다. 예를 들어, 문헌에 의해 보고된 SET 점수와 품질과의 불완전한 상관관계를 고려할 때, 두 강사 사이에 실질적인 품질 차이가 있다고 결론짓기 전에 관리자가 SET 점수에 큰 차이를 요구한다고 가정한다. 따라서 SET 점수가 동료보다 낮은 강사가 불량 교사로 식별될 경우 관리자는 오류 가능성을 최소화하기 위해 이 컷오프를 낮은 수준으로 설정했을 것으로 가정합니다.
- 마지막으로, 학생 학습과 무관한 강사 수업 평균 SET 점수의 특이적 차이를 모델링하지만, 이러한 특이적 차이는 안정적이며 특정 그룹(예: 여성 또는 대표성이 부족한 소수자)에 대한 체계적 편견을 대표하지 않는다고 가정한다.
Rather than empirically assessing the reliability, validity, or unbiasedness of SET scores as measures of teaching proficiency, we assume the most optimistic possible conditions that can be supported by empirical literature and then study the outcomes of using SET scores as tools for assessing and managing university faculty.
- First, we assume that overall instructor SET ratings are moderately correlated with actual instructional quality (e.g. student learning and/or instructional best practices) in the course. The highest correlations reported in the literature are on the order of ρ ≈ 0.4, so we use this level of correlation as the basis for our study. We also assume that an instructor’s class average SET scores are perfectly reliable (i.e. an instructor’s class average SET score is always the same and thus perfectly known). This is equivalent to assuming that a faculty member is assessed using the average of a large number of class-average SET scores, or alternatively that class average SET scores are perfectly stable.
- Second, we assume that administrators use SET scores in the careful and judicious manner recommended by experts (e.g. Boysen et al. 2014; Benton and Young 2018). For example, we assume that administrators require a large difference in SET scores before concluding that there is a real difference in quality between two instructors, given the imperfect correlation of SET scores with quality reported by the literature. Relatedly, if instructors who receive lower SET scores than their peers are identified as poor teachers, we assume that administrators set this cutoff to a low level in order to minimize the possibility for error.
- Finally, although we model the idiosyncratic difference in instructor class-average SET scores that is unrelated to student learning, we assume that these idiosyncratic differences are both stable and not representative of any systematic bias against a particular group (e.g. women or under-represented minorities).
이러한 가정은 SET 점수, 교육 품질 및 관리 평가 모델에 대한 정보를 제공합니다. 구체적으로는 교직원 i의 클래스 평균 강사 SET 점수 si의 백분위수 순위(원점수나 값이 아닌)와 교사로서의 실제 자질을 연구한다.여기서 qi는 교직원이 학생 학습에 진정으로 기여하는 것 및/또는 교육 모범 사례에 대한 적합성을 나타낸다. 예를 들어,
- si = 40은 교직원의 전체 SET 점수가 교직원의 총 모집단에서 SET 점수의 40%보다 우수하다는 것을 의미하며,
- qi = 40은 같은 교직원이 동료의 40%보다 우수하다는 것을 의미합니다.
These assumptions inform our model of SET scores, the quality of instruction, and administrative assessment. Specifically, we study the percentile rankings (rather than raw scores or values) of a faculty member i’s class average overall instructor SET scores si and their actual quality as a teacher qi, where qi represents a faculty member’s true contribution to student learning and/or their conformity with instructional best practices.
For example,
> si = 40 means that the faculty member’s overall SET score is better than 40% of SET scores from the total population of faculty members,
> while qi = 40 means that the same faculty member is a better instructor than 40% of his/her peers.
이러한 척도는 백분위수이기 때문에 기본 SET 점수 또는 강사 품질 메트릭이 어떻게 분포되는지에 관계없이 각각은 si ~ U [0, 100] 및 qi ~ U [0, 100]의 균일한 한계 분포를 가집니다. (si, qi)의 공동분포는 si와 qi가 고정공통값 θ에서 상관관계를 갖는 것으로, 상관관계가 θ인 정규연관을 사용하여 이를 모델링한다(Hofert 2018, 페이지 87).
Because these measures are percentiles, each has a uniform marginal distribution regardless of how the underlying raw SET score or instructor quality metric is distributed: si ∼ U [0, 100] and qi ∼ U [0, 100]. The joint distribution of (si, qi) is such that si and qi are correlated at a fixed and common value of ρ; we model this using a normal copula with correlation ρ (Hofert 2018, p. 87).
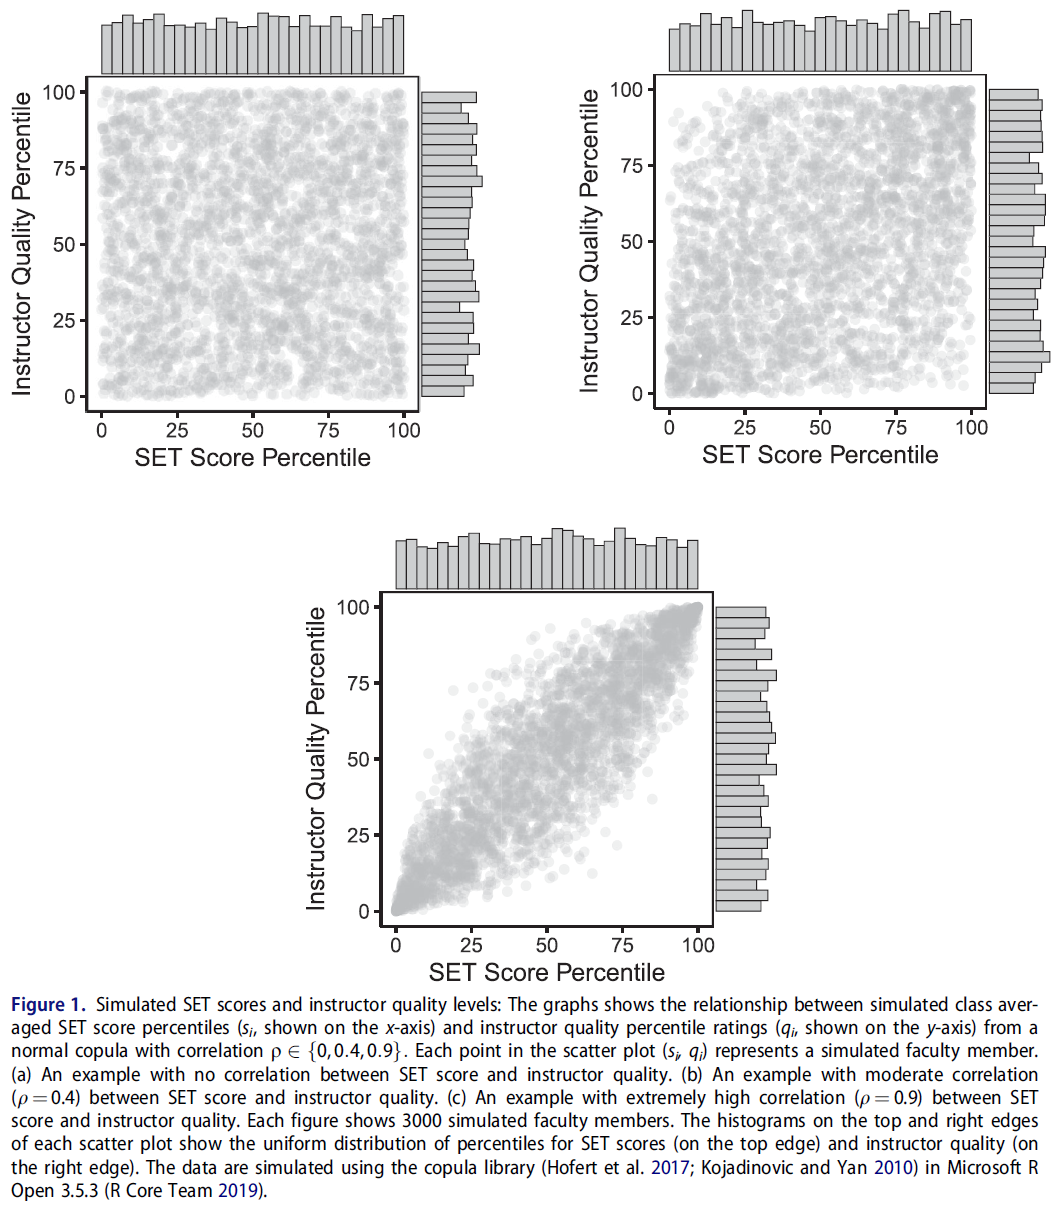
그림 1은 모델을 사용하여 교수진의 SET 점수 및 실제 교육 품질 값을 백분위수로 시뮬레이션하는 세 가지 예를 보여줍니다. 산점도(si, qi)의 각 점은 개별 교직원 i의 클래스 평균 SET 점수 백분위수(x축)와 실제 교육 품질 백분위수(y축)를 나타냅니다.
- 그림 1(a)에서 SET 점수와 실제 강사 품질 사이에는 아무런 관계가 없습니다(표준 = 0).
- 그림 1(b)에서 SET 점수와 강사 품질 사이의 상관관계는 경험적 문헌에 의해 지원되는 최대값과 거의 일치하는 값으로 설정된다(set = 0.4).
- 마지막으로, 그림 1(c)은 상관 관계를 매우 높게 설정한다(표준 = 0.9).
Figure 1 shows three examples of how we simulate faculty members’ SET scores and true instructional quality values as percentiles using our model. Each point in a scatter plot (si, qi) represents an individual faculty member i’s class average SET score percentile (on the x-axis) and true instructional quality percentile (on the y-axis).
- In Figure 1(a), there is no relationship between SET score and true instructor quality (ρ = 0).
- In Figure 1(b), the correlation between SET score and instructor quality is set at a value roughly consistent with the maximum value supported by empirical literature (ρ = 0.4).
- Finally, Figure 1(c) sets the correlation extremely high (ρ = 0.9).
각 산점도 상단 및 오른쪽 모서리의 히스토그램에는 SET 점수 백분위수(위 모서리)와 교직원 교육 품질(오른쪽 모서리)의 한계 균일한 분포가 표시됩니다. 각각의 시뮬레이션에서는, 특정의 ρ 를 가지는 통상의 코풀라로부터 다수의 교직원을 추출해, 그러한 교직원을 사용해 SET 스코어의 특정의 관리상의 용도가, 좋은 교사와 나쁜 교사의 구별에 있어서 얼마나 효과가 있는지를 평가합니다. 시뮬레이션에서 각 교직원의 진정한 강사 자질을 알 수 있기 때문에 이상적인 조건에서 이러한 관리 용도가 얼마나 잘 수행되는지 정확하게 평가할 수 있습니다.
The histograms on the top and right edges of each scatter plot shows the marginal uniform distribution of SET score percentiles (top edge) and faculty instructional quality (right edge). Each one of our simulations draws a large number of faculty members from the normal copula with a specified ρ and uses those simulated faculty members to assess how well particular administrative uses of SET scores work in terms of distinguishing good teachers from bad. Because we know the true instructor quality of each faculty member in our simulations, we are able to accurately assess how well these administrative uses perform under ideal conditions.
우리의 모델은 테일러와 러셀(1939)의 모델과 유사하며, 테일러와 러셀(1939)은 표준화된 평가(점수 테스트 등)를 사용하여 이 [표준화된 평가]가 [근로자의 직무 성과]와 유의하지만, 불완전하게 상관되어 있을 때(수준 r) 근로자를 선택하는 결과를 연구했다. Taylor와 Russell은 저비용의 전자컴퓨팅 이전에 근무하고 있었기 때문에, (평가의 엄격성(즉, 고용되는 평가 노동자의 비율), 평가의 유효성(r) 및 작업 성과가 최소한 허용 가능한 모집단의 근로자 비율이 주어졌을 때) 평가에 의해 선택된 종업원의 비율을 나타내는 표를 작성했습니다. 이러한 표를 통해 관리자는 복잡한 계산 없이 정보에 입각한 결정을 내릴 수 있었습니다.
Our model is similar to that of Taylor and Russell (1939), who studied the consequences of using a standardized assessment (such as a scored test) to select workers when this assessment is meaningfully but imperfectly correlated (at level r) with those workers’ job performance. Because Taylor and Russell were working at a time before low-cost electronic computing, their main contribution was producing tables showing what proportion of workers selected by the assessment would be acceptable given the stringency of the assessment (i.e. what proportion of assessed workers would be hired), the validity of the assessment (r), and the proportion of workers in the population whose job performance would be at least minimally acceptable; these tables enabled managers to make informed decisions without complex calculation.
같은 이유로 테일러와 러셀은 연속 표준화 평가 지표(예: 시험 점수)와 근로자 품질의 연속 표준화 측정치가 상관 관계 r을 갖는 단위 이변량 정규 밀도에 따라 분포될 것이라고 가정했다. Naylor와 Shine(1965)은 다양한 평가 조건에서 선택된 근로자의 평균 표준화된 업무 성과를 보여주는 이 표의 버전을 작성했다. 이들의 수정된 접근방식은 관리자들이 표준화된 평가를 통해 얼마나 많은 선택이 기준 수준과 비교하여 노동자의 평균 품질을 개선할 수 있는지를 결정할 수 있게 했다.그는 전체 인구입니다. Naylor와 Shine은 이러한 표준화된 품질 점수 사이의 상관 단위 이변량 정규 분포에 대한 가정을 유지했습니다. 이러한 모델은 과거 고등교육 평가 연구에 성공적으로 적용되었다. 예를 들어, Owen과 Li(1980)는 수정된 Taylor-Russell 접근방식을 사용하여 대학 입학 요건으로 최소한의 표준화된 시험 점수 성과를 요구하는 효과를 연구한다.
For the same reason, Taylor and Russell assumed that the continuous standardized assessment metric (e.g. a test score) and the continuous standardized measure of worker quality would be distributed according to a unit bivariate normal density with correlation r. Naylor and Shine (1965) created a version of these tables showing the average standardized job performance of workers selected under varying assessment conditions; their modified approach allowed managers to determine how much selection via standardized assessment would improve the average quality of a workforce relative to the baseline level of the overall population. Naylor and Shine maintained the assumption of a correlated unit bivariate normal distribution between these standardized quality scores. These models have been successfully applied to the study of assessment in higher education in the past; for example, Owen and Li (1980) study the effectiveness of requiring minimum standardized test score performance as a requirement for college admissions using a modified Taylor–Russell approach.
이 모델을 사용하여 SET 점수의 두 가지 일반적인 관리 용도를 연구합니다.
- 교직원의 쌍별 비교
- 각 교직원의 SET 점수를 모든 교직원의 SET 점수 전체 분포와 비교합니다.
We use our model to study two common administrative uses of SET scores:
- for pairwise comparison of faculty members; and
- for comparison of an individual faculty member’s SET score to the overall distribution of SET scores from all faculty.
이러한 용도는 SET가 의사결정에 정보를 제공할 수 있는 현실적인 시나리오를 다루도록 설계되어 있습니다. 예를 들어, 테뉴어 평가는 종종 최근의 사례를 참고한다. 후보자의 SET 점수와 최근의 테뉴어 사례의 점수를 쌍으로 비교하여 교육 성과에 기초한 결정을 정당화할 수 있다. 채용 결정에는 소수의 교직원을 서로 비교하는 것이 포함됩니다. SET 점수의 쌍별 비교는 어떤 후보가 더 나은 교사인지 판단하기 위해 사용될 수 있습니다. 아마도 가장 가능성이 높은 것은 교직원의 SET 점수를 모든 교직원의 SET 점수 모집단이 많은 것과 비교하여 동료보다 현저히 나쁜 교직원의 SET 점수를 식별할 수 있다는 것입니다. 예를 들어, 강사는 SET 점수가 학과 또는 대학 중간 점수보다 낮은지 여부에 따라 평가될 수 있습니다. 우리는 그러한 비교가 테뉴어 심사나 임기 전 평가의 일부로서 일어날 것이 거의 확실하다고 기대한다.
These uses are designed to cover realistic scenarios in which SETs may inform decision-making. For example, tenure evaluations often make reference to cases from the recent past; pairwise comparison of a candidate’s SET scores to those of a recent tenure case might be used to justify a decision based on teaching performance. Hiring decisions involve comparing a small number of faculty members to one another; a pairwise comparison of SET scores might be used to adjudicate which candidate is a better teacher. Perhaps most likely of all, a faculty member’s SET scores might be compared to the larger population of SET scores from all faculty in order to identify those whose teaching performance is markedly worse than their peers. For example, an instructor might be judged according to whether his/her SET scores are below the department or university median score. We expect that such a comparison is almost guaranteed to happen as part of a tenure review or a pre-tenure evaluation.
Microsoft R Open 3.5.3(R Core Team 2019)의 copula 라이브러리를 이용하여 ρ 의 상관관계를 갖는 일반 copula에서 SET 점수 백분위수와 강사 품질 백분위수 1,000,000개를 추출하여 이러한 절차의 영향을 모델링합니다. 그림 1과 같이 SET 점수 및 강사 품질 백분위수의 각 추첨은 단일 교직원을 나타냅니다. 그리고 첫 번째 절차에서는 첫 번째 50만 SET 점수 추첨과 두 번째 50만 SET 점수 추첨을 비교하여 SET 점수가 높은 교직원이 질 높은 강사이기도 한 시간의 비율을 결정합니다. 두 번째 절차에서는 100만 SET 점수 추첨을 모두 최소 백분위수 임계값과 비교하여 SET 점수가 임계값 미만인 모든 교직원을 모집단에서 분리한 후 SET 백분위수 임계값 미만 교직원의 강사 품질 점수를 조사합니다.
We model the impact of these procedures by sampling 1,000,000 draws of SET score percentiles and instructor quality percentiles from a normal copula with correlation ρ using the copula library (Hofert et al. 2017; Kojadinovic and Yan 2010) in Microsoft R Open 3.5.3 (R Core Team 2019). As illustrated in Figure 1, each draw of a SET score and an instructor quality percentile represents a single faculty member. Then, for the first procedure, we compare the first 500,000 SET score draws to the second 500,000 SET score draws to determine the proportion of the time that the faculty member with the higher SET score is also a higher quality instructor. For the second procedure, we compare all 1,000,000 SET score draws to a minimum percentile threshold, separate all faculty members whose SET score is below that threshold from the population, then examine the instructor quality scores of faculty members who are below the SET percentile threshold.
한 가지 방법론적인 선택은 특히 주의를 요한다. 즉, 원점수 또는 표준화된 점수 대신 일반 코풀라를 사용하여 SET 점수 및 강사 성과 백분위수를 시뮬레이션하는 선택이다(표준 측정, 즉 z 점수는 평균이 0이고 표준 편차가 1로 조정되었다). 이 선택에는 중요한 이점이 있습니다.SET 점수 또는 강사 품질 등급의 특정 한계 분포를 가정하지 않아도 됩니다. 그러나 결론에서 다시 살펴보겠지만, 상관관계 ρ 은 SET 점수와 강사 자질 사이의 많은 가능한 관계와 일치하며, 다른 관계는 SET 점수를 사용하여 교직원을 평가하는 다른 결과를 초래한다. 원점수나 표준점수보다 백분위수에 초점을 맞추면 정확한 한계분포를 지정하는 문제를 피할 수 있고, 모든 SET 점수나 교육 품질 지표가 백분위수 등급의 동일한 분포를 가져야 하므로 분석을 보다 광범위하게 적용할 수 있다. 즉, 대학이 학생에게, 예를 들면, 다른 질문의 표현이나 다른 응답 척도를 사용하는 등, 전체적인 강사의 평가를 요구하는 방법에 관계없이, 그러한 평가의 퍼센티지는 균일하게 분포할 필요가 있습니다.따라서 시뮬레이션에서는 이러한 SET 중 하나를 사용하는 경우의 결과를 보다 잘 모델링할 수 있습니다.
One methodological choice requires particular attention: our choice to simulate percentiles of SET scores and instructor performance using the normal copula rather than raw or standardized scores (a standardized measure, i.e. a z-score, is one that has been rescaled to have a mean of zero and a standard deviation of one). This choice comes with an important advantage: it enables us to avoid assuming any particular marginal distribution of SET scores or instructor quality ratings. However, as we will revisit in the conclusion, a correlation ρ is consistent with many possible relationships between SET score and instructor quality and different relationships result in different consequences of using SET scores to evaluate faculty. Focusing on percentiles rather than raw or standardized scores allows us to sidestep the issue of specifying correct marginal distributions and makes our analysis more broadly applicable, as any SET scores or instructional quality metrics must have the same distribution of percentile ratings. That is, no matter how a university asks its students for an overall instructor rating – for instance, using different question wording or different response scales – the percentiles from those ratings must be distributed uniformly and therefore our simulations are better able to model the consequences of using any one of these SETs.
그러나 우리의 절차에는 한계가 있다.
- 첫째, 한계 분포 함수와 상관 계수를 지정한다고 해서 SET 점수와 교직원 품질 사이의 고유한 공동 분포를 의미하는 것은 아니다(Hofert 2018, 페이지 47). 동일한 균일하게 분포된 SET 점수와 강사 품질 지표는 모두 동일한 상관 관계를 갖는 다른 패턴을 가질 수 있다. 따라서 우리의 결론은 매우 다양한 공통적인 상황에 일반화되어 있다고 믿지만, 가능한 모든 경우에 반드시 적용되는 것은 아니다.
- 또한 경험적 문헌은 종종 원시 또는 z-점수의 표준화된 SET 점수와 시험 점수와 같은 학생 성취도의 직접적인 척도 사이의 상관관계를 연구한다. 이러한 척도에 대한 백분위 순위 간의 상관관계가 아니라, 우리는 이러한 차이가 분석의 일부에서 중요하지 않다고 가정해야 한다. 따라서, 우리는 분석을 특정 SET 시스템 사용의 결과에 대한 거울 같은 시뮬레이션이 아니라 합리적이고 가능성 있는 조건에서 무엇이 잘못될 수 있는지를 보여주는 유용한 예시로 간주한다.
- 결론의 견고성을 높이기 위해 정규 연결부를 통해 균일하게 분포되지만 상관 관계가 있는 백분위수 대신 이변량 정규 분포 SET 점수 및 교직원 품질 지표를 사용하여 분석을 반복했다. 온라인 부록에 보고된 결과는 질적으로 우리의 주요 finding과 유사하다. 결론에서 연구의 의미를 설명할 때 이 방법론적 선택에 대한 논의로 돌아갈 것이다.
However, there are limitations to our procedure.
- First, specifying marginal distribution functions and a correlation coefficient does not imply a unique joint distribution between SET scores and faculty quality (Hofert 2018, p. 47): the same uniformly distributed SET scores and instructor quality metrics can have different patterns of relationship that all have the same correlation ρ. Consequently, although we believe that our conclusions generalize to a wide variety of common circumstances, they do not necessarily apply to every possible case.
- Moreover, the empirical literature often studies the correlation between raw or z-score standardized SET scores and direct measures of student achievement like exam scores (e.g. Benton, Duchon, and Pallett 2013, pp. 380–383), not the correlation between percentile rankings for these measures; we must assume that this difference is not consequential in parts of our analysis. Consequently, we consider our analysis an informative illustration of what can go wrong under reasonable and likely conditions, not a mirror-like simulation of the outcome of using any particular SET system.
- Toward the end of increasing the robustness of our conclusions, we repeated our analyses using bivariate normally distributed SET scores and faculty quality metrics instead of uniformly distributed but correlated percentiles created via a normal copula; the results, which are reported in an online appendix, are qualitatively similar to our main findings. We will return to a discussion of this methodological choice when describing the implications of our study in the conclusion.
결과.
Results
그림 2는 평균 SET 점수를 사용하여 교직원을 쌍으로 비교한 결과를 보여줍니다. 이러한 SET 점수가 순전히 무작위로 할당된 경우, SET 점수에 의해 실제로 더 poor한 교수가 더 나은 강사로 식별되는 경우는 50%이다 (즉, si -sj와 qi -qj는 한 쌍의 교직원에 대해 같은 부호를 가집니다). 따라서 50%의 오류율은 평가 성과에 대한 최소 기준입니다. 참고로 분석에서는 si = sj를 qi = qj일 경우에만 올바른 예측으로 취급합니다. 또한 qi = qj일 때만 si = sj이면 올바른 예측으로 취급됩니다. 이것들은 엣지 케이스이며 계산상으로는 발생할 가능성이 거의 없습니다.
Figure 2 shows the result of conducting pairwise comparisons of faculty members using average SET scores. If these SET scores were assigned purely at random, the faculty member who was truly a poorer instructor would be identified by SET scores as the better instructor 50% of the time (that is, si −sj and qi −qj have the same sign for a pair of faculty members i and j). Therefore, a 50% error rate is the minimum baseline of evaluation performance. As a side note, our analysis treats si = sj as a correct prediction if and only if qi = qj. In addition, when qi = qj only si = sj is treated as a correct prediction. These are edge cases and computationally unlikely to occur.
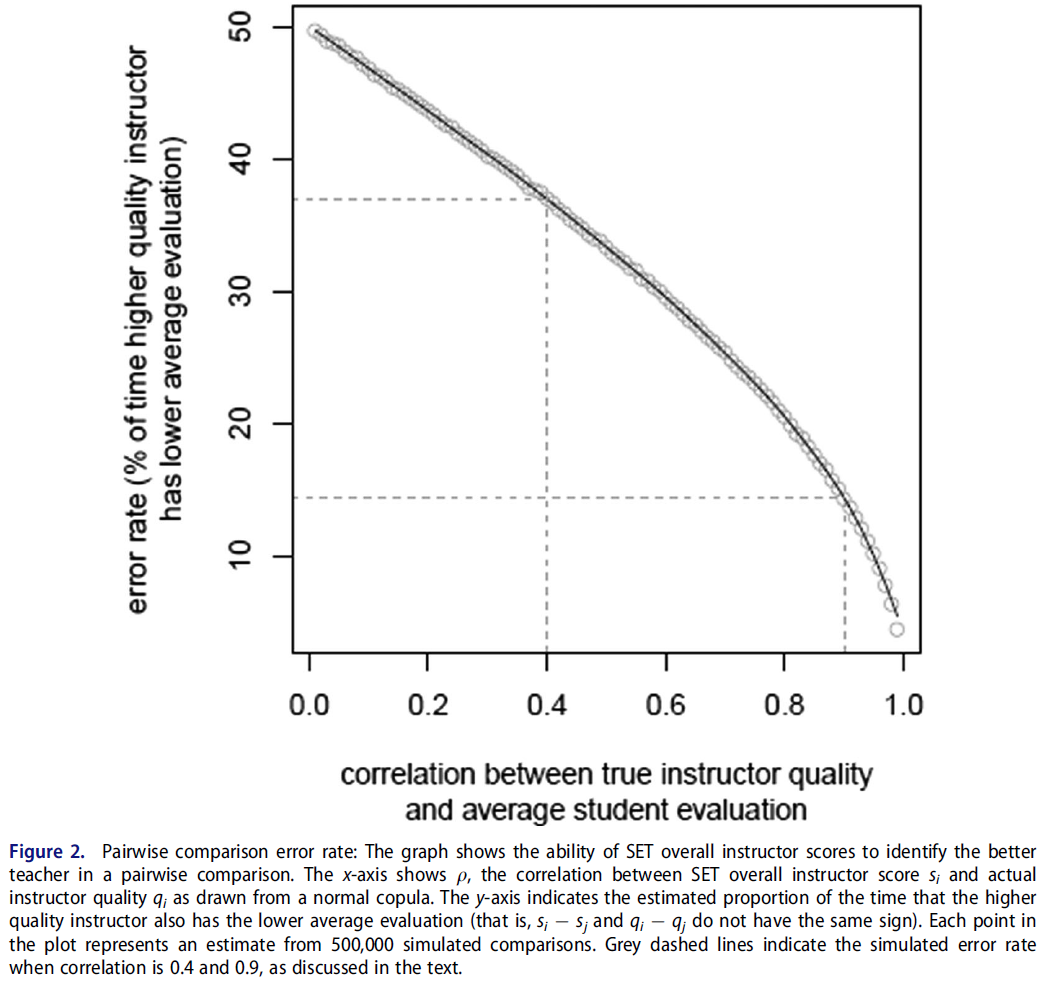
그림 2는 진정한 질과 전체적인 강사 SET 평가 사이에 [중간 정도의 상관관계]가 있더라도 교직원의 수업 평균 SET 점수를 비교하면 허용할 수 없을 정도로 높은 에러율을 얻을 수 있음을 보여준다. 경험적 문헌에 따르면 현실적으로 기대할 수 있는 가장 높은 상관관계는 0.4이다. 품질과 SET 점수 간의 이러한 상관 관계 수준에서 시뮬레이션에서 품질이 낮을수록 평균 SET 점수가 거의 37% 더 높습니다. 즉, SET 점수를 완벽하게 신뢰할 수 있고 교육의 질과 중간 정도의 상관관계를 갖는 것으로 두 교원을 비교하는 것은 잘못된 교원을 1/3 이상의 시간 동안 더 나은 교사로 식별할 수 있습니다. 실제 데이터에서 가능한 것보다 훨씬 높은 θ = 0.9인 경우에도 품질이 낮은 강사는 평균 SET 점수가 14% 이상 더 높습니다.
Figure 2 shows that comparing faculty members’ class average SET scores results in an unacceptably high error rate, even when there is moderate correlation ρ between true quality and overall instructor SET evaluation. Based on the empirical literature, ρ ≈ 0.4 is the highest correlation we can realistically expect. At this level of correlation between quality and SET scores, the poorer quality instructor in our simulation has a higher average SET score almost 37% of the time. That is, using SET scores that are perfectly reliable and moderately correlated with teaching quality to compare two faculty members can identify the wrong faculty member as a better teacher over one third of the time. Even when ρ = 0.9, far higher than possible in real data, the poorer-quality instructor still has a higher average SET score over 14% of the time.
SET 점수가 행정 결정에서 중요한 역할을 한다고 믿는 학자들은 SET 점수에서 매우 작은 차이를 심각하게 받아들이는 것을 지지하지 않는다(Boysen et al. 2014; Benton and Young 2018). 따라서 분석 고정 ρ = 0.4를 반복하여 한 교직원이 다른 교직원보다 더 나은 교직원이라는 결론을 내리기 위해 필요한 백분위수 SET 점수 격차의 크기를 변경하였다. 그 결과는 그림 3에 나타나 있다.
Scholars who believe that SET scores have a role to play in administrative decisions do not endorse taking very small differences in SET score seriously (Boysen et al. 2014; Benton and Young 2018). Therefore, we repeated our analysis fixing ρ = 0.4 and varied the size of the gap in percentile SET scores necessary to conclude that one faculty member is truly a better instructor than another. The result is depicted in Figure 3.
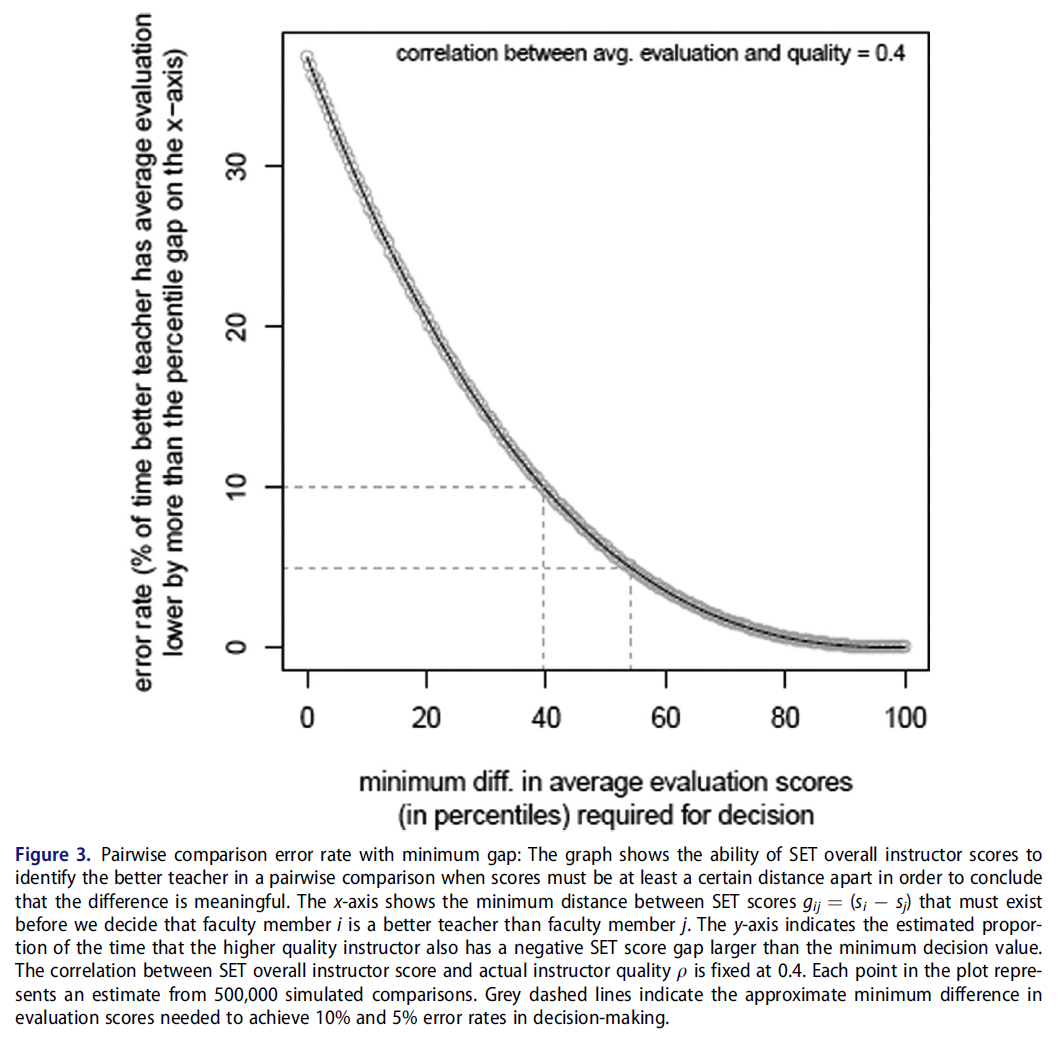
강사 품질에 대한 판단을 형성하기 위해 SET 점수 사이의 최소 거리를 요구하는 것은 단순히 SET 점수의 차이를 심각하게 받아들이는 것보다 상당히 개선된다. 그러나 시뮬레이션에서 SET 점수의 차이는 의사결정 오류가 허용 가능한 수준에 도달하기 전에 실제로 매우 커야 한다. 그림 3과 같이 시뮬레이션된 교직원이 39퍼센트 이상의 SET 점수 차이로 분리된 경우에만 오류율이 10%에 도달합니다. 심지어 이러한 비교에서도 poor한 강사는 10번 중 1번 이상 우수한 강사로 식별됩니다. 5%의 오류율은 SET 점수가 약 54% 포인트 떨어져 있는 교직원만을 비교해야 달성될 수 있다. 그러나 시뮬레이션된 쌍별 비교의 약 21%만이 SET 점수에서 적어도 이만큼 큰 차이를 보였다. 즉, 어떤 교수가 더 나은 교사인지에 대한 결정은 할 수 없었다.대부분의 경우에서 그렇습니다.
Requiring a minimum distance between SET scores in order to form a judgement about instructor quality does improve considerably on simply taking any difference in SET scores seriously. However, the gap in SET scores in our simulation must be very large indeed before errors in decision making reach an acceptable level. As Figure 3 shows, only when our simulated faculty members are separated by a SET score difference of over 39 percentile points does the error rate reach 10%. Even these comparisons identify the wrong instructor as better one out of ten times. A five percent error rate can be achieved in our simulation by comparing only faculty members whose SET scores are separated by about 54 percentile points; however, only about 21% of our simulated pairwise comparisons had a difference in SET scores at least this large, meaning that no decision about which professor was a better teacher could be made in the vast majority of cases.
마지막으로, 교직원을 명시적으로 비교하지 않고, 리뷰 프로세스의 일부로서 모든 교직원의 전체 모집단과 비교할 수 있습니다.예를 들어 관리자는 교직원의 SET 점수를 학과 또는 대학 중앙 SET 점수와 비교할 수 있습니다. 상관관계가 0.4로 고정된 정상 코풀라에서 1,000,000 SET 점수와 실제 강사 품질 수준을 추출하여 이 수행 평가를 시뮬레이션한 후 SET 전체 강사 점수의 20번째 백분위 이하 교직원을 low-quality 교사로 식별하였다. 중위수 대신 20번째 백분위수를 사용하는 것은 단순히 뛰어나지 않은 교사가 아니라 최악의 교사를 식별하는 SET의 신중한 관리 사용을 나타내기 위한 것입니다. 마지막으로 SET 점수가 낮은 교직원 모집단에서 진정한 강사 품질 수준의 분포를 조사합니다. 그 결과는 그림 4와 같다.
Finally, faculty may not be explicitly compared to one another but rather compared to the overall population of all faculty as part of a review process; for example, administrators may compare a faculty member’s SET scores to the department or university median SET score. We simulated this performance evaluation by drawing 1,000,000 SET scores and true instructor quality levels from a normal copula with correlation fixed at ρ = 0.4, then identified faculty members at or below the 20th percentile of SET overall instructor score as low-quality teachers. Using the 20th percentile instead of the median is intended to represent a careful administrative use of SETs that identifies the worst teachers, not simply teachers who are not exceptionally good. Finally, we examine the distribution of true instructor quality levels in this population of faculty members with poor SET scores. The result is shown in Figure 4.
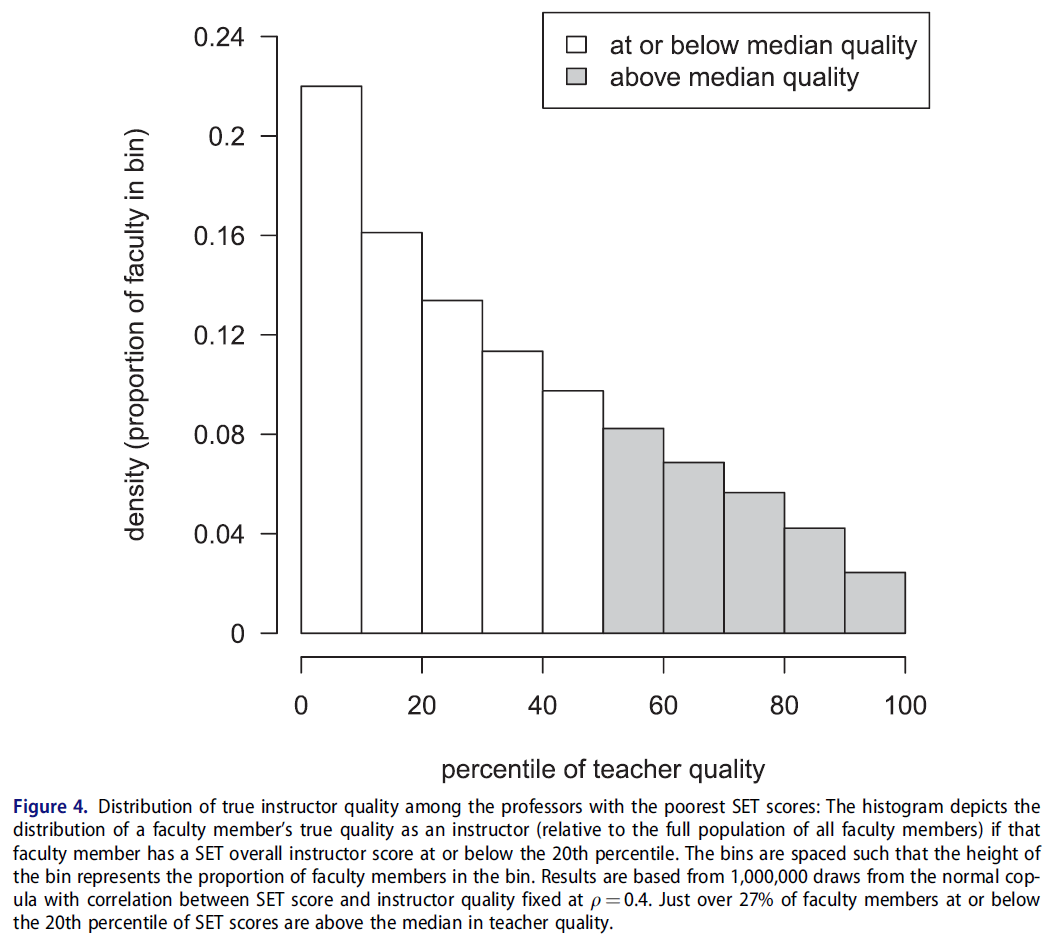
그림 4는 SET 점수와 실제 강사의 질 사이에 중간 정도의 상관관계가 있더라도, 학생 평가에서 가장 성적이 나쁜 일부 학생은 시뮬레이션에서 여전히 좋은 교사임을 보여줍니다. 구체적으로, SET의 20번째 백분위 이하에 있는 모의 교수진의 27% 이상이 실제로 강사 품질의 중위수를 초과했습니다. 실증연구 결과가 뒷받침하는 가장 낙관적인 조건하에서 SET 성적은 상대적으로 낮은 층에서도 열악한 교사로 지목된 교수 4명 중 1명이 실제로 일반 교수보다 더 능력이 있는 시나리오를 만들 수 있다는 점은 불안하다. 이 문제는 사용하는 분포에 대해 대칭적이라는 점에 유의하십시오. 즉, SET 점수가 80번째 백분위수를 초과하는 교직원의 27% 이상이 실제로 교육자로서의 퀄리티에서 중간값 이하에 있습니다.
Figure 4 shows that, even with moderate correlation between SET scores and true instructor quality, some of the worst performers on student evaluations of teaching are still good teachers in our simulation. Specifically, over 27% of simulated faculty members at or below the 20th percentile on SETs were actually above the median of instructor quality. It is disturbing that even a relatively low floor for SET performance under the most optimistic conditions supported by empirical study results can create a scenario where one in four faculty members identified as a poor teacher is actually more capable than the typical professor. Note that the problem is symmetric for the distributions we use: that is, over 27% of faculty members with SET scores over the 80th percentile are actually at or below the median in instructor quality.
실제로, 뛰어난 SET 점수조차 교직원의 질을 나타내는 신뢰할 수 있는 지표가 되지 않습니다. 가장 높은 평가를 받은 교수 선발 과정을 시뮬레이션하기 위해 그림 4의 분석을 반복하여 SET 점수에서 95번째 백분위 이상의 모의 교직원을 식별하였다. 이 엘리트 그룹의 교직원 중 18% 이상이 중간 강사와 다를 바 없다는 것을 알게 되었습니다. SET 점수가 매우 높은 교사의 자질 평가의 완전한 분포는 부록 그림 7을 참조하십시오. 이러한 결과에 근거해, 상당수의 교사상 수상자가, 실제로 보통의 교수에 비해 teaching에 서투른 것을 발견할 수 있을 것이다. 따라서 SET 점수가 낮으면 좋은 교수가 나쁜 것으로 잘못 인식될 뿐만 아니라 보통보다 못한 교수가 매우 숙련된 것으로 인식되는 경우가 많습니다. 앞에서와 마찬가지로, 이 문제는 대칭적적으로 발생한다. 즉, SET 점수가 5퍼센타일 이하(매우 낮은)인 교직원의 18% 이상이 실제로 교사의 질에서 중위수 이상입니다.
Indeed, not even exceptional SET scores are a reliable indicator of faculty quality. To simulate the process of selecting the most highly-rated professors for special recognition, we repeated the analysis of Figure 4 and identified simulated faculty members above the 95th percentile in SET scores. We find that over 18% of this elite group of faculty are no better than the median instructor; see Appendix Figure 7 for the full distribution of teacher quality ratings for those with extremely high SET scores. Based on these results, it would not be unusual to find that a substantial proportion of teaching award winners are actually worse at teaching than the ordinary faculty member. Thus, not only do poor SET scores often mis-identify good professors as bad, they can often identify worse-than-mediocre professors as exceptionally skilled. As before, the problem is symmetric for the distributions that we examine: over 18% of faculty members with SET scores at or below the 5th percentile are actually above the median in instructor quality.
결론
Conclusion
우리의 증거는 교직의 학생 평가에 대한 일반적인 사용이 그러한 평가들이 매우 신뢰성이 높고, 어떤 그룹에 대해서도 편견이 없으며, 진정한 교수진의 질과 적당히 상관되어 있을 때 많은 불공정한 결과를 쉽게 만들어 낼 수 있다는 것을 보여준다. 우리가 보는 것처럼, 근본적인 문제는 학생들의 평가 점수에 대한 무관한 영향이 이 점수에 근거해 결정을 내리는 것이 너무 우연에 의한 것이라는 것이다. 동시에, 우리는 학생 평가가 이용 가능한 대안보다 비용 및 표준화 측면에서 상당한 이점을 가지고 있다는 것을 인식하고 있습니다. 어떻게 해야 할까요? 우리는 세 가지 추천을 합니다.
Our evidence indicates that common uses for student evaluations of teaching can easily produce many unfair outcomes when those evaluations are extremely reliable, unbiased against any group, and moderately correlated with true faculty quality. As we see it, the fundamental problem is that irrelevant influences on student evaluation scores make decisions based on these scores too subject to chance. At the same time, we recognize that student evaluations have substantial advantages in terms of cost and standardization over available alternatives. What should be done? We make three recommendations.
첫째, SET를 만들고 독립적인 연구에 의해 뒷받침된 일부 회사가 이미 작성한 권고사항과 일치한다. 우리는 코스 평균 학생 평가 점수가 어떠한 목적에 사용되기 전에, [체계적인 비교육적 영향(즉, 편견)을 제거하기 위해 통계적으로 조정되어야 한다]고 믿는다. 예를 들어, 선형 회귀 분석에서는 성별, 인종 및 과정 유형에 기인하는 과정 평균 SET 점수의 변동을 추출한 후 이러한 점수를 교직원 평가에 사용할 수 있습니다. 이러한 특성이 교육 및 학습과 무관한 한, 결과적으로 조정된 점수는 원시 SET 점수보다 실제 강사 품질과 더 강하게 상관되어야 하며 부정확성은 감소합니다. 또 다른 대안으로, 이러한 특징에 대한 점수를 일치시킨 다음 일치된 그룹 내에서만 비교할 수 있다. 이는 IDEA가 이미 채택한 접근법과 유사하다. 이 절차에서는 SET 점수에 대한 순수하게 랜덤한 영향이나 특이적인 영향을 제거할 수 없습니다.따라서 이 조정에도 SET 점수와 강사 품질 간의 상관관계가 1에 근접할 것으로 예상되지 않습니다. 그러나 우리가 권장하는 조정은 이 상관관계를 최대한 높일 것으로 믿습니다.
First, consonant with the recommendations already produced by some companies that create SETs (e.g. Benton and Young 2018) and supported by independent research (e.g. Nargundkar and Shrikhande 2014), we believe that course-averaged student evaluation scores should be statistically adjusted to remove any systematic non-instructional influences (i.e. biases) before they are used for any purpose. For example, linear regression could extract any variance in course average SET scores attributable to gender, race, and course type before these scores are used to evaluate faculty. As long as these characteristics are irrelevant to teaching and learning, the resulting adjusted scores should be more strongly correlated with true instructor quality than the raw SET scores and imprecision will be reduced. As another alternative, scores could be matched on these characteristics and then compared only within the matched groups; this is similar to the approach already taken by IDEA (Benton and Li 2017, p. 5). This procedure cannot remove purely random or idiosyncratic influences on SET scores, and so even with this adjustment we do not expect that correlation between SET scores and instructor quality will be close to 1. But we believe that the adjustment we recommend will make this correlation as high as it can be.
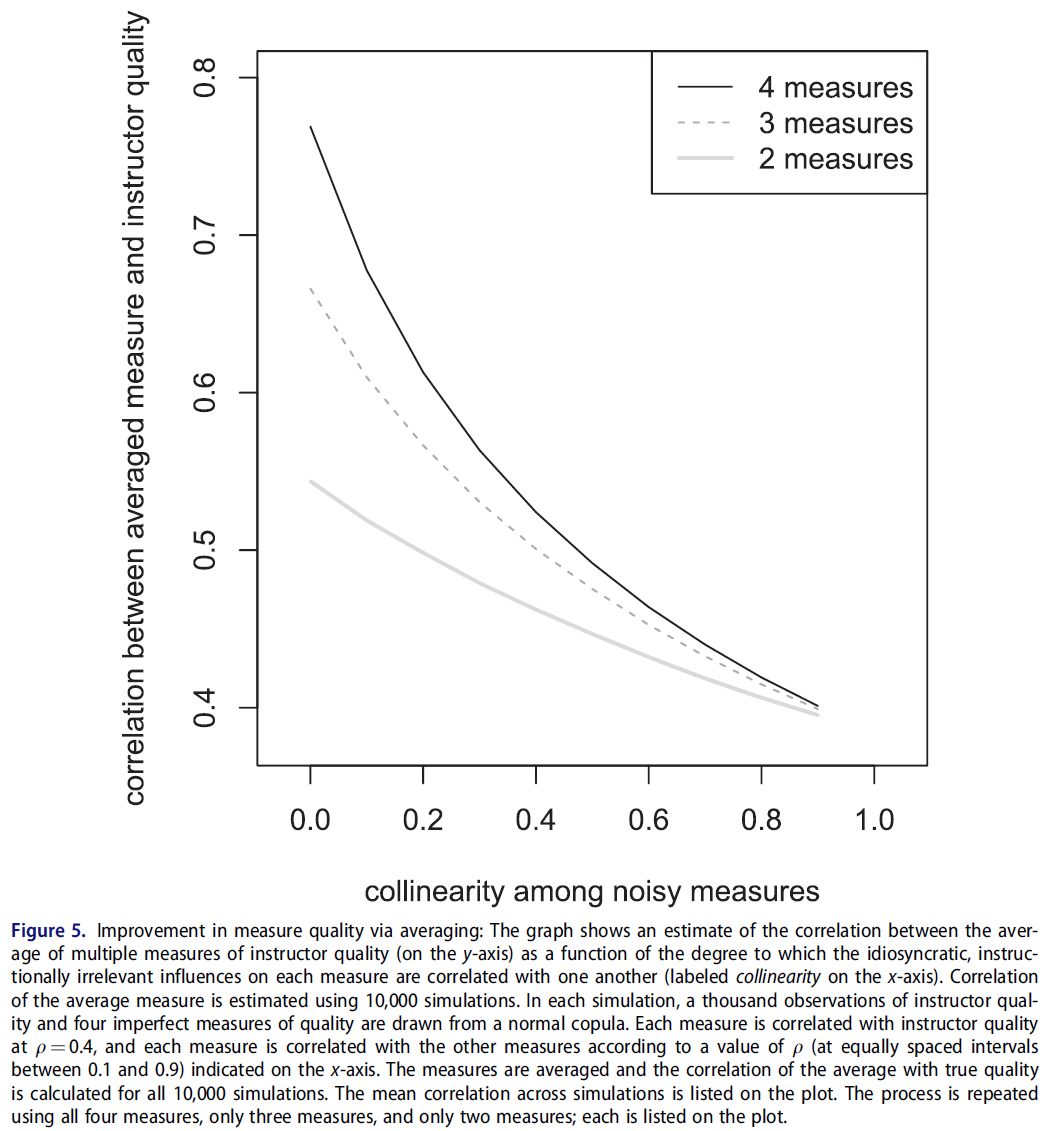
둘째, 기존 권고사항과 마찬가지로, SET 점수를 사용하여 중요한 인사 결정을 내릴 때, 교직원의 [교육 성과를 종합적으로 평가하기 위해 여러 다른 척도와 연계]하여야 한다고 생각합니다. 모든 방법(SET를 포함하지만 이에 국한되지 않음)은 교수 교육 퀄리티의 노이즈와 문제를 야기할 수 있는 측정을 생성하기 때문에, '교습 평가의 증거로서 적절한 단일 척도는 없다.' 그러나, 모든 측정이 모두 같은 방식으로 노이즈를 발생시키거나 편향되지 않는 한, 교육을 평가하기 위해 모든 측정치를 동시에 사용하면 보다 타당한 평가를 할 수 있습니다. 그림 5를 보면, 실제 교사의 질과 그 평균 소음 측정 사이의 상관 관계를 알 수 있다. 노이즈가 있는 각 측정치는 θ = 0.4의 품질과 상관되며, 측정치는 x축에 표시된 것과 같이 서로 상관됩니다(그림에 공선성으로 표시됨). 측정치 간의 공진성이 낮으면 이러한 측정치에 대한 특이적 영향과 지시적으로 무관한 영향이 각각 다르다는 것을 나타낸다. 측정값 간의 공선성이 높으면 각 측정값의 편중과 불완전성이 매우 유사하다는 것을 의미한다. 그래프에서 알 수 있듯이, 4개의 다른 측정치에 대한 결합된 평가의 타당성은 이러한 측정치가 다른 방식으로 불완전하다면 어떤 개별 측정치보다 훨씬 더 나을 수 있다.
Second, and also consistent with prior recommendations (Benton and Young 2018), we believe that SET scores should be used in concert with multiple, dissimilar measures in order to comprehensively evaluate the teaching performance of faculty members when significant personnel decisions are being made. Because every method (including but not limited to SETs) produces a noisy and possibly problematic measure of faculty instructional quality, ‘no single measure is adequate as evidence for evaluating teaching’ (Benton and Young 2018, p. 3). However, as long as these measures are not all noisy or biased in the same way, employing them all simultaneously to evaluate teaching can result in a more valid assessment. Consider Figure 5, which shows the correlation between true teacher quality and an average of noisy measures thereof. Each noisy measure is correlated with quality at ρ = 0.4, and the measures are correlated with each other as indicated on the x-axis (which we label in the figure as collinearity). When collinearity among the measures is low, it indicates that idiosyncratic and instructionally irrelevant influences on these measures are different for each one. When collinearity among the measures is high, it means that the biases and imperfections of each measure are very similar. As the plot shows, the validity of a combined assessment of four different measures can be substantially better than any individual measure as long as these measures are imperfect in different ways.
물론 이런 종류의 종합평가에는 비용이 많이 듭니다. 모든 교직원이 매년 자기평가, 강의계획표 등의 동료검토, 숙련된 전문가의 강의실 직접관찰, 학생 관리자에 의한 광범위한 인터뷰 등을 실시해야 합니다. 따라서 SET 점수는 이 보다 포괄적인 평가를 위해 일부 교직원을 초기에 선별하는 저비용 수단이 될 수 있다고 생각합니다. 시뮬레이션의 증거에 근거해, 이 평가의 대상이 되는 교직원의 대부분이 좋은 교사(및 선발되지 않은 교직원은 나쁜 교사)가 되는 것을 강조하는 것이 중요합니다. 그러므로, 우리는 교수님의 가르침을 집중적으로 평가하기로 한 결정이 징벌적인 것으로 여겨져서는 안 된다고 생각한다. 또, 이 집중 평가는 SET 점수가 낮은 교직원만을 대상으로 실시되어서는 안 됩니다. 여기서 설명한 것처럼, 일부의 저조한 강사가 우연히 좋은 학생 평가를 받게 될 것으로 예상되기 때문에, SET 점수가 좋은 교원의 랜덤 서브셋도 집중 평가를 위해서 선택되어야 한다고 생각합니다.
Of course, this kind of comprehensive assessment is very costly; it requires all faculty to engage in self-assessment, peer review of syllabi and other course materials, direct observation of their classroom teaching by trained experts, extensive interviews by administrators of their students, and the like on an annual basis. Therefore, we believe that SET scores could serve as a low-cost means to initially screen some faculty members for this more comprehensive evaluation. Based on our simulation evidence, we think it important to emphasize that many of the faculty members selected for this evaluation will be good teachers (and some faculty members not selected will be poor teachers). Therefore, we believe that the decision to intensively evaluate a professor’s teaching should not be viewed as punitive. Nor should this intensive evaluation be performed solely on faculty with low SET scores; as we showed in this article, we expect that some poor instructors will receive good student evaluations by chance and thus we think that a random subset of faculty with good SET scores should be selected for intensive evaluation as well.
마지막으로, SET 점수와 교원 질 간의 상관관계가 일정하게 유지되어도, [SET 점수]와 [교수자 퀄리티] 사이의 공동 분포joint distribution 형태가 SET 점수의 유용성에 영향을 미칠 수 있다는 점에 유의해야 한다. 위에서 설명한 바와 같이, 우리의 분석은 백분위수가 항상 균일하게 분포되어 있기 때문에 (원시 SET 점수나 교직원 품질 측정이 아닌) 백분위수 순위 간의 상관관계를 가정한다. 이를 통해 우리의 분석을 보다 다양한 사례에 적용할 수 있습니다. 그러나 동일한 상관 관계가 매우 다른 분포에 해당할 수 있습니다. SET 점수 백분위수에 따라 대학의 교수진을 평가하는 것은 SET 기구나 대학마다 다를 수 있는 교사의 질과 정확히 어떤 관련이 있는지에 따라 여전히 문제가 될 수 있다.
Finally, we think that administrators and faculty members should be mindful that the shape of the joint distribution between SET scores and instructor quality can impact the usefulness of SET scores even when the correlation between SET scores and faculty quality is held constant. As noted above, our analysis presumes a correlation between percentile rankings (rather than raw SET scores or faculty quality measures) because percentiles are always uniformly distributed. This makes our analysis applicable to a broader variety of cases. However, the same correlation can correspond to very different distributions. Evaluating a university’s faculty according to their performance on SET score percentiles can still be problematic depending on precisely how they are related to teacher quality, which might vary both among SET instruments and universities.
이 현상의 간단한 예는 그림 6과 같다. 그림의 두 패널은 X축의 SET 점수와 Y축의 교직원 품질 점수 사이의 관계를 나타냅니다. 두 경우 모두 SET 점수는 평균 0과 표준 편차 1로 표준화됩니다. 두 패널 모두 동일한 ρ = 0.4에서 교직원 품질과 상관된 SET 점수를 나타냅니다.
- 왼쪽 패널(그림 6(a))은 SET 점수와 교수 퀄리티의 양봉 분포를 나타내고 있습니다. 대부분의 교직원은 평균보다 약간 높은 SET 점수로 분산되어 있으며, 실제 교직원의 질은 널리 분산되어 있지만, 소수의 교직원은 신뢰할 수 있는 저품질 강사이며, SET에서도 점수가 낮은 경향이 있습니다.
- 오른쪽 패널은 그림 6(a)의 분포와 동일한 분산-공분산 행렬을 가진 이변량 정규(단일) 분포를 보여준다. 수직 점선은 각 사례에 대한 SET 점수의 10번째 백분위수를 나타내며 수평 점선은 중위수 교직원 품질 점수를 나타냅니다.
A simple example of this phenomenon is shown in Figure 6. Both panels of the figure depict a relationship between SET scores on the x-axis and faculty quality score on the y-axis. In both cases, SET scores are standardized with a mean of 0 and a standard deviation of 1; both panels also depict SET scores that are correlated with faculty quality at an identical ρ ≈ 0.4. However,
- the left panel (Figure 6(a)) shows a bimodal distribution of SET scores and faculty quality: most faculty are distributed around a slightly above-average SET score and are widely dispersed in true quality, but a small number of faculty are reliably low quality instructors and also tend to score poorly on SETs.
- The right panel shows a bivariate normal (unimodal) distribution with the same variance-covariance matrix as the distribution in Figure 6(a). The vertical dashed line shows the 10th percentile of SET scores for each case, while the horizontal dashed line shows the median faculty quality score.
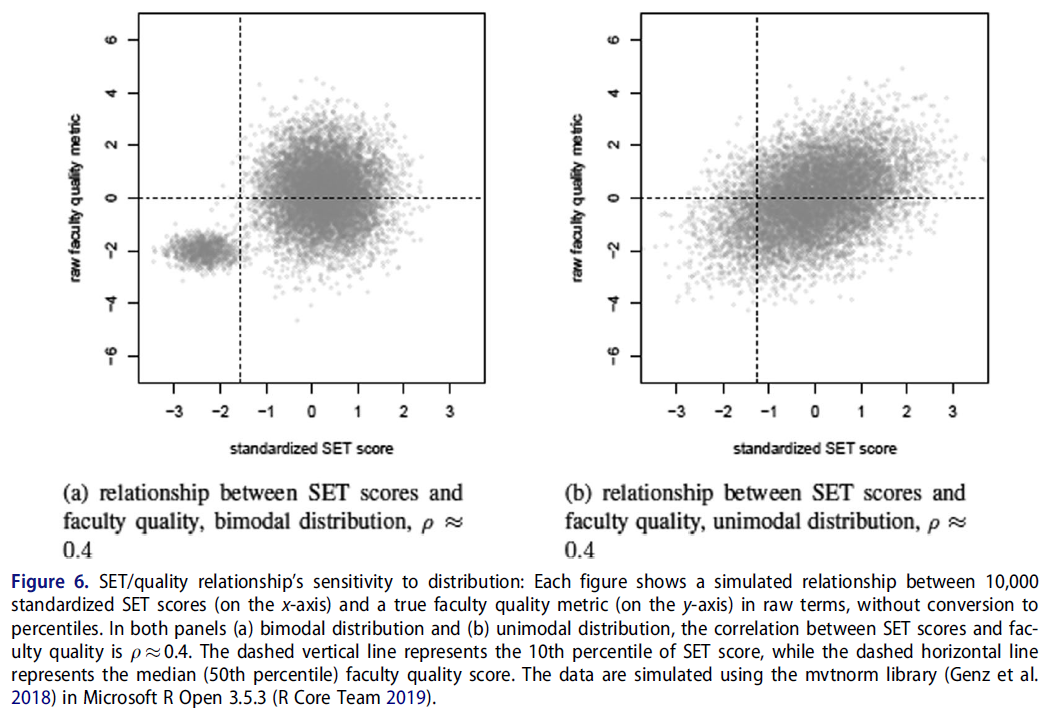
- 그림 6(a)의 쌍봉 분포에서는, SET 점수의 10번째 백분위 이하에 해당하는 사람 중, 1% 미만만 실제로 중위수 강사보다 우수합니다. 따라서, 이 백분위수를 poor한 교수자를 식별하기 위한 차단으로 사용하는 것은 이 시나리오에서 매우 효율적이고 대부분 공평할 것이다.
- 그림 6(b)의 단일 분포에서는, SET 점수의 10번째 백분위 이하에 해당하는 사람 중, 21% 이상이 실제 퀄리티 면에서 중위수보다 우월하다. 따라서, 이 경우에 poor한 교수자를 식별하기 위해 낮은 SET 점수를 사용하는 것은 불공평합니다.
- In the bimodal distribution of Figure 6(a), fewer than 1% of faculty below the 10th percentile of SET scores are better than the median instructor. Thus, using this percentile as a cutoff to identify poor teachers would be quite efficient and mostly fair in this scenario.
- However, in the unimodal distribution of Figure 6(b), over 21% of faculty below the 10th percentile of SET scores are nevertheless above the median in terms of true quality. Thus, in this other case, using low SET scores to identify bad instructors would be unfair.
일반적으로 모집단에서 진정한 교수 퀄리티의 분포를 직접 관찰할 수 없기 때문에 SET 점수 사용자는 자신이 어떤 상황에 처해 있는지 알 수 없습니다. 이번 연구는 주의를 기울일 필요성을 강조하며, SET 점수가 보다 철저하고 비용이 많이 들며 정확한 교육 성과 조사가 필요하다는 우리의 결론을 강화한다고 생각합니다.
Because we generally cannot directly observe the distribution of true faculty quality in any relevant population, a user of SET scores has no way to know which situation they are in. We think this demonstration underscores the need for caution, and reinforces our conclusion that SET scores are best used as an indicator of the need for a more thorough, costly, and accurate investigation of teaching performance.
Scholarly debate about student evaluations of teaching (SETs) often focuses on whether SETs are valid, reliable and unbiased. In this article, we assume the most optimistic conditions for SETs that are supported by the empirical literature. Specifically, we assume that SETs are moderately correlated with teaching quality (student learning and instructional best practices), highly reliable, and do not systematically discriminate on any instructionally irrelevant basis. We use computational simulation to show that, under ideal circumstances, even careful and judicious use of SETs to assess faculty can produce an unacceptably high error rate: (a) a large difference in SET scores fails to reliably identify the best teacher in a pairwise comparison, and (b) more than a quarter of faculty with evaluations at or below the 20th percentile are above the median in instructional quality. These problems are attributable to imprecision in the relationship between SETs and instructor quality that exists even when they are moderately correlated. Our simulation indicates that evaluating instruction using multiple imperfect measures, including but not limited to SETs, can produce a fairer and more useful result compared to using SETs alone.
'Articles (Medical Education) > 교수개발(Faculty Development)' 카테고리의 다른 글
| 임상 교수자의 교육개발 참여의 모순: 활동이론 분석(Adv Health Sci Educ Theory Pract. 2019) (0) | 2022.04.03 |
|---|---|
| 프로포절 준비 프로그램: NIH 연구비 지원 촉진을 위한 그룹 멘토링, 교수개발 모델(Acad Med, 2022) (0) | 2022.03.26 |
| 교수 리더십 개발: 시너지적 접근의 사례 연구(Med Teach, 2021) (0) | 2022.03.18 |
| 보건의료전문직 교육에서 수행능력이 낮은 수련생의 실패-실패 BEME Guide No. 42 (Med Teach, 2016) (0) | 2022.03.11 |
| 교육자 역할을 나의 정체성에 통합하기: 초기 학부 의학 교수자 질적연구(Adv in Health Sci Educ, 2017) (0) | 2022.02.28 |